For the first two decades of the twentieth century, baseball was a game about not making outs and stealing the occasional run. Then, almost within a single season, it became a game about hitting the ball over a fence. The shift was so sharp that the eras have names — the “dead-ball” era and the “live-ball” era — as if a different sport began in 1920.
The numbers bear the names out. In 1908, the average team scored about 3.43 runs per game and hit roughly 0.109 home runs per game — one team homer about every nine or ten games. A century later that same league hits more than a home run per team per game as a matter of routine. This is the story of how the run environment moved, told through the per-game rates that make the eras directly comparable.
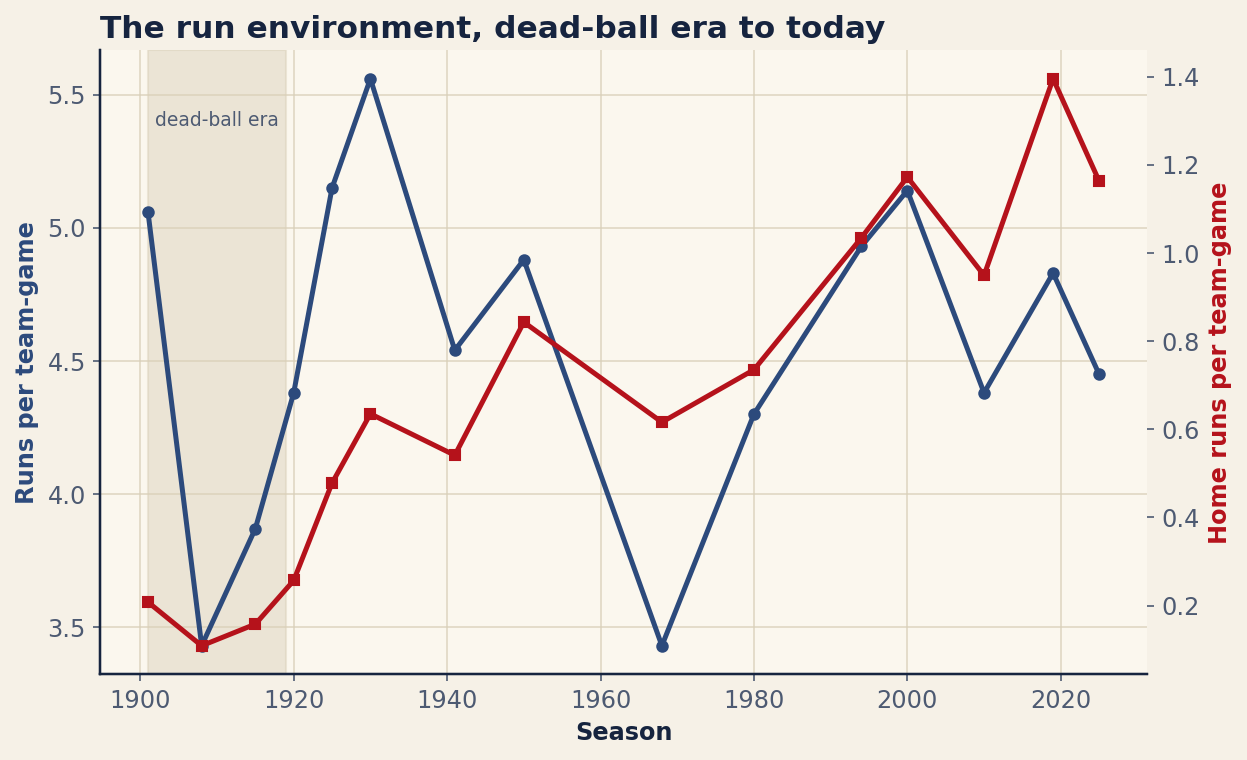
Reading run environments per team-game
Comparing eras by raw league totals is hopeless, because the number of teams and the length of the schedule both changed. The fix is to put everything on a per-team-per-game basis: runs per team-game and home runs per team-game. Those rates describe what an average team did on an average day, and they let 1908 and 2025 sit honestly in the same column. One scope note before the numbers: this data covers the American and National Leagues only. The script filters to the two majors that ran continuously across the whole span, so that a Federal League season or a defunct circuit doesn’t distort the apples-to-apples comparison.
The table tracks three things across selected seasons — runs per team-game, home runs per team-game, and league batting average. Read down the home-run column in particular; it is the single clearest fingerprint of which era you are standing in.
| Season | R/team-game | HR/team-game | League AVG |
|---|---|---|---|
| 1901 | 5.06 | 0.208 | 0.272 |
| 1908 | 3.43 | 0.109 | 0.239 |
| 1915 | 3.87 | 0.158 | 0.248 |
| 1920 | 4.38 | 0.257 | 0.276 |
| 1925 | 5.15 | 0.478 | 0.292 |
| 1930 | 5.56 | 0.635 | 0.296 |
| 1941 | 4.54 | 0.541 | 0.262 |
| 1950 | 4.88 | 0.843 | 0.266 |
| 1968 | 3.43 | 0.616 | 0.237 |
| 1980 | 4.3 | 0.735 | 0.265 |
| 1994 | 4.93 | 1.034 | 0.27 |
| 2000 | 5.14 | 1.172 | 0.27 |
| 2010 | 4.38 | 0.949 | 0.257 |
| 2019 | 4.83 | 1.395 | 0.252 |
| 2025 | 4.45 | 1.163 | 0.245 |
What made the dead ball dead
The low scoring of the early century was not an accident of weak hitters; it was the physical conditions of the game. A single baseball was often kept in play for most of a game, sometimes the whole thing. As it absorbed dirt, tobacco juice, and repeated contact, it grew soft, lopsided, and progressively harder to see — a scuffed, discolored ball that traveled less and broke more. Pitchers were free to deface it further. Parks were cavernous, with outfield distances that turned would-be home runs into long outs. And the prevailing approach matched the equipment: hitters choked up, slapped at the ball, bunted, and ran, because swinging for distance with a mushy ball in a huge park was a poor bet.
The 1908 line in the table is the dead-ball era distilled: 3.43 runs per team-game, 0.109 home runs per team-game, and a .239 league average. Offense came from singles, walks, steals, and the other team’s mistakes. A team that scratched out four runs was usually winning.
1920: the ball comes alive
The turn was abrupt. Cleaner baseballs — replaced more frequently and kept whiter and harder — came into the game, a change accelerated by the death of Ray Chapman, struck by a pitch he likely never saw in 1920, after which keeping a fresh, visible ball in play became a safety imperative as much as an offensive one. At the same time, Babe Ruth was demonstrating that an uppercut swing aimed at the seats could produce something no slap hitter ever had. The combination — a livelier, more visible ball and a hitter proving that power paid — rewired the sport’s incentives.
You can watch it happen in the home-run column. Home runs per team-game roughly double from 0.109 in 1908 to 0.257 in 1920, then double again to 0.478 by 1925. The league average climbs from .239 to .276 to .292 across the same rows. Ruth did not single-handedly raise the seas, but he showed everyone which way the tide was going, and the league followed within a few seasons.
1930: the offensive high-water mark
The live-ball revolution overshot. By 1930 the average team was scoring about 5.56 runs per game — the highest figure on this chart — with home runs at 0.635 per team-game and a league batting average of .296. That is a season in which an average team scored five and a half runs a night and hitters as a group flirted with .300. It remains the peak run environment of the live-ball era; nothing since, including the famously offense-heavy turn of the millennium, has pushed runs per team-game back up to the 1930 mark.
After 1930 the line settles. The 1941 and 1950 rows show a game that has found a more sustainable middle — four and a half to five runs a game, home runs climbing steadily as ballparks shrank and approaches modernized — without the runaway scoring of 1930.
1968: the Year of the Pitcher
Then the pendulum swung hard the other way. By 1968 scoring had collapsed back to 3.43 runs per team-game — numerically identical, in this data, to dead-ball 1908 — on a .237 league average, the lowest on the chart. The cause was different this time: a tall pitching mound, an expanded strike zone, and a generation of dominant power pitchers had tilted the game toward run prevention. The home-run rate (0.616) shows it was not a return to dead-ball conditions; it was specifically a pitchers’ environment, with hitters unable to do much of anything else.
Baseball reacted directly. After the 1968 season the rule-makers lowered the pitching mound and shrank the strike zone, deliberately engineering offense back into the game. The 1980 row — 4.3 runs per team-game — reflects the more balanced game those changes restored.
The modern home-run era
The most recent chapter is defined by the home run more than by runs. Through the 1990s and 2000s the home-run rate kept climbing — past 1.0 per team-game in 1994, to 1.172 in 2000 — and then, after a dip, the launch-angle revolution sent it to its peak. In 2019 the average team hit 1.395 home runs per game, the highest mark in this data, as hitters across the league consciously optimized for elevation and exit velocity. The remarkable part is that batting average did not come along for the ride: 2019’s .252 is closer to dead-ball territory than to 1930. The modern game trades contact for power on purpose.
The 2025 line shows where that leaves things: about 4.45 runs per team-game and 1.163 home runs per team-game, on a .245 league average. Set that beside 1908 — 3.43 runs, 0.109 home runs, .239 — and the through-line of the whole century snaps into focus. Batting averages have drifted back down near where they started, but the home run, once an oddity at roughly one per team every nine games, now arrives more than once per team every single game.
The bottom line
Put on a per-team-game basis, the history of major-league offense is a single legible curve: a dead-ball trough, a live-ball explosion peaking in 1930, a pitching-driven collapse in 1968 that the rules themselves corrected, and a modern era that chased the home run to record heights while letting batting average slide. The two endpoints rhyme on average — .239 then, .245 now — but they could not be more different in how runs get made. The ball is the same size it always was; almost everything else about how it gets hit has changed.
Sources & Further Reading
- For the fundamentals, see Chapter 11: Working with Dates, Times, and Time Series Data in DataField.dev’s free textbook library.
- Per-team-game rates and league averages: MLB.com (MLB Stats API historical league totals and standings, AL and NL only). Retrieved June 2026; re-runnable via
scripts/deadball_era.py. - Baseball-Reference — season-by-season league batting and pitching encyclopedias.
- SABR — historical accounts of the dead-ball era, the 1920 transition, and the 1968 rule changes.