Every spring a few hitters come out hot and the internet declares them changed men. Most of them aren’t. A six-week heater is the easiest thing in baseball to fake — a few seeing-eye singles, a friendly schedule, a couple of wind-aided home runs — and the surface numbers can stay inflated for months before the bottom falls out. The hard question isn’t “is this player hot?” It’s “is this player better?” Those are not the same question, and Statcast is the only place that reliably tells them apart.
What follows is a four-test framework for separating a real breakout from a lucky streak, with one worked example running through all of it. In 2025 George Springer, deep into his thirties and seemingly in decline, posted one of the largest expected-offense jumps in baseball. We’ll use him to show what a genuine breakout looks like under the hood.
Test 1: Do the expected stats move, not just the results?
The first filter throws out most pretenders. Batting average, slugging, and even wOBA are outcome stats — they record what happened, luck and defense and ballpark included. The expected stats, xwOBA and xSLG, record what should have happened given how hard and at what angle every ball was hit. If a hitter’s results have spiked but his expected stats haven’t, you’re looking at variance wearing a costume. If both move together, something structural has changed. This is the same done-versus-deserved gap covered in our guide to expected stats, used here as a lie detector.
Springer clears this bar emphatically. His xwOBA climbed from .325 in 2024 to .404 in 2025 — a 79-point jump — while his xSLG leapt from .412 to .571. Those aren’t the fingerprints of a lucky month; they’re the contact profile of a different, and far more dangerous, hitter. The figure below plots the biggest expected-wOBA risers across the two seasons, and Springer’s line is one of the steepest on the board.
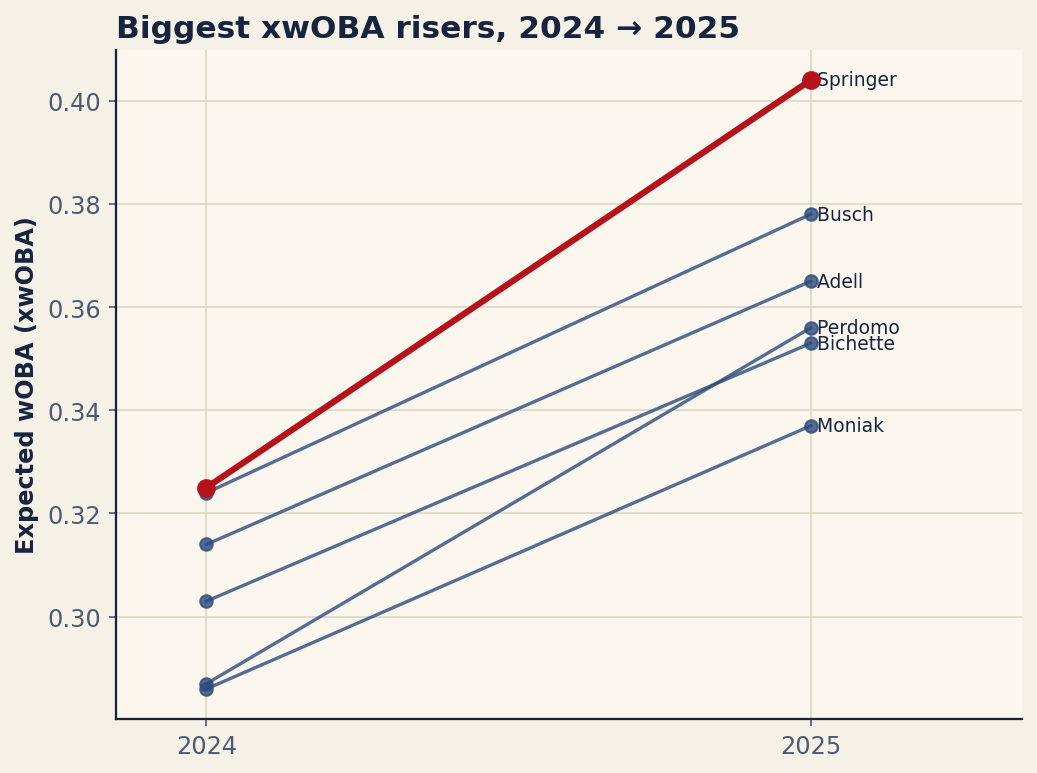
One more guardrail belongs in this test: sample size. An expected-stat jump over 120 plate appearances is interesting; over a full season it’s evidence. Springer’s came across 614 plate appearances in 2024 and 586 in 2025 — two full, healthy seasons. There’s no small-sample escape hatch here, which is exactly what you want before you believe a 35-year-old reinvented himself.
| Player | PA '24 | PA '25 | xwOBA '24 | xwOBA '25 | Δ | xSLG '24 | xSLG '25 |
|---|---|---|---|---|---|---|---|
| George Springer | 614 | 586 | 0.325 | 0.404 | 0.079 | 0.412 | 0.571 |
| Geraldo Perdomo | 388 | 720 | 0.287 | 0.356 | 0.069 | 0.326 | 0.424 |
| Michael Busch | 567 | 592 | 0.324 | 0.378 | 0.054 | 0.432 | 0.548 |
| Mickey Moniak | 418 | 461 | 0.286 | 0.337 | 0.051 | 0.387 | 0.497 |
| Jo Adell | 451 | 573 | 0.314 | 0.365 | 0.051 | 0.426 | 0.549 |
| Bo Bichette | 336 | 628 | 0.303 | 0.353 | 0.05 | 0.377 | 0.473 |
| Gleyber Torres | 665 | 628 | 0.314 | 0.363 | 0.049 | 0.386 | 0.462 |
| Ramón Laureano | 309 | 488 | 0.313 | 0.362 | 0.049 | 0.438 | 0.518 |
The table is also a reminder that not every riser is the same animal. Geraldo Perdomo jumped from a .287 to a .356 xwOBA, but he did it while more than tripling his playing time, from 388 plate appearances to 720 — a young player consolidating a role, which is a different story than an established veteran changing shape. Michael Busch (.324 to .378 xwOBA, .432 to .548 xSLG) and Jo Adell (.314 to .365, with xSLG up from .426 to .549) read more like Springer: real gains in contact quality over comparable workloads. The framework’s job is to tell those cases apart, and it starts by demanding the expected stats move.
Test 2: Did batted-ball quality improve?
Expected stats are downstream of contact, so the second test asks why xwOBA and xSLG moved. The inputs are the raw quality-of-contact numbers: average exit velocity, hard-hit rate (the share of batted balls struck at 95+ mph), and above all barrel rate — the percentage of batted balls in the launch-speed-and-angle sweet spot that produces extra-base damage. Barrels are the single most predictive contact stat there is, which is why they get their own treatment in our barrel-rate explainer.
The logic of the test is simple: a 159-point jump in xSLG, like Springer’s, has to be paid for in harder, better-angled contact. You cannot fake an xSLG that high; the model only awards it to balls that were genuinely smoked at productive angles. So when the expected-power number moves the way Springer’s did, it is itself the receipt — it is telling you the barrels and the hard-hit balls showed up, because nothing else generates that figure. A breakout that passes Test 1 on power almost by definition passes Test 2; the value of stating the test separately is to remind you to check that the engine, not the scoreboard, did the work.
Test 3: Did plate discipline change?
Contact quality is half of hitting; the other half is contact frequency and pitch selection. The third test looks at the plate-discipline column: chase rate (swings at pitches outside the zone), whiff rate (swings and misses), and the resulting walk and strikeout numbers. These matter for two reasons. First, they’re a hitter’s most repeatable skills — discipline metrics stabilize faster and fluctuate less than outcome stats, so a real change here is strong evidence of a real change overall. Second, they protect a breakout’s floor: a hitter who is squaring the ball up and chasing less has two engines driving the gains, not one.
This is also where the framework hits an honest limit. The dataset behind this article is the Statcast expected-stats leaderboard, which gives us xwOBA and xSLG cleanly but does not carry the full discipline breakdown for every hitter. Rather than invent chase and whiff figures, I’ll be straight about it: confirming Test 3 for Springer means going to his Baseball Savant page and reading the percentile sliders directly. The point of the test stands regardless — a breakout that also shows a lower chase rate or a better walk-to-strikeout ratio is far more trustworthy than one resting on contact quality alone — and you should always run it before betting on a hitter staying broken out.
Test 4: Is there a story that makes it sustainable?
The final test is the least quantitative and the most important. Numbers tell you that something changed; a mechanism tells you why, and a why is what makes a breakout sustainable rather than seasonal. Did the hitter rebuild his swing, change his stance or his hand position, move on the plate, adopt a new approach against a pitch that used to beat him? A documented mechanism turns a statistical blip into a plausible new baseline, because it gives you a reason to expect the gains to carry forward instead of regressing.
This is the test you can’t run from a spreadsheet, and it’s where reading, beat reporting, and swing video earn their keep. For a case like Springer’s — a veteran posting a 79-point xwOBA jump and a 159-point xSLG jump across two full seasons — the numbers all but demand a mechanism, and the analyst’s job is to go find it: the adjustment, the health change, the swing tweak that the data is implicitly pointing at. When the story and the Statcast page agree, you have a breakout you can believe in. When the numbers jump but no one can explain how, stay skeptical, because the most likely explanation is the one the expected stats already ruled out in Test 1: luck.
The bottom line
A real breakout leaves the same four-part signature every time: the expected stats move, not just the results; the contact quality that feeds them is genuinely better; the plate discipline holds or improves; and there’s a mechanism that explains the whole thing. George Springer’s 2025 — xwOBA from .325 to .404, xSLG from .412 to .571, over two full healthy seasons — clears the tests we can measure from this data and points hard at the ones we can’t. Run any hot start through these four filters before you buy in. Most streaks fail at the first test. The ones that pass all four are the players actually worth chasing.
Sources & Further Reading
- Chapter 6: Numerical Summaries: Center, Spread, and Shape covers the foundations; it’s free to read at DataField.dev.
- Expected-stat data: Baseball Savant (Statcast expected-statistics leaderboard, 2024 and 2025, min. 300 PA). Figures retrieved June 2026; re-runnable via
scripts/breakout_framework.py. - MLB.com — Statcast glossary definitions for xwOBA, xSLG, barrel rate, and the plate-discipline metrics.
- FanGraphs — plate-discipline leaderboards and breakout analysis.