Exit velocity gets the highlight-reel love — the 118-mph rocket, the number that flashes on the broadcast graphic — but it is a blunt instrument for measuring a hitter. A 110-mph ball hit straight into the dirt is a routine groundout, and a 110-mph ball at 27 degrees is a souvenir. Raw exit velocity cannot tell those two apart. Statcast’s barrel rate can, and that is why it is the single best public number for predicting power.
A barrel is not just a hard-hit ball. It is a hard-hit ball struck at the angle that turns velocity into damage. Combine the two ingredients correctly and you get the contact that, historically, becomes extra-base hits at an almost comic rate. Count how often a hitter produces it, and you have isolated power at its source.
What counts as a “barrel”
Statcast defines a barrel as a batted ball whose combination of exit velocity and launch angle has historically produced a batting average of at least .500 and a slugging percentage of at least 1.500. That is the entire definition, and it is empirical, not arbitrary: the league reached those thresholds on those balls, so those balls earn the label.
The mechanics fall out of that standard. A barrel requires an exit velocity of at least 98 mph — below that, no launch angle clears the bar. At exactly 98 mph the qualifying window is narrow, roughly 26 to 30 degrees, the heart of line-drive-into-low-fly territory. As exit velocity climbs, that window widens in both directions, because a ball hit hard enough does damage across a broader range of angles. By 116 mph the barrel zone stretches from about 8 degrees all the way up past 50. The faster you hit it, the more forgiving the angle requirement becomes — which is exactly how physics ought to work.
Why rate beats average exit velocity
Average exit velocity answers “how hard does this hitter typically hit the ball?” That is useful, but it blurs the thing that actually scores runs. Two hitters can post an identical 92-mph average EV while living in completely different offensive worlds: one sprays hard grounders and lazy flies that average out, the other splits his contact between weak pop-ups and barreled missiles that also average out. The mean hides the distribution, and the distribution is the whole game.
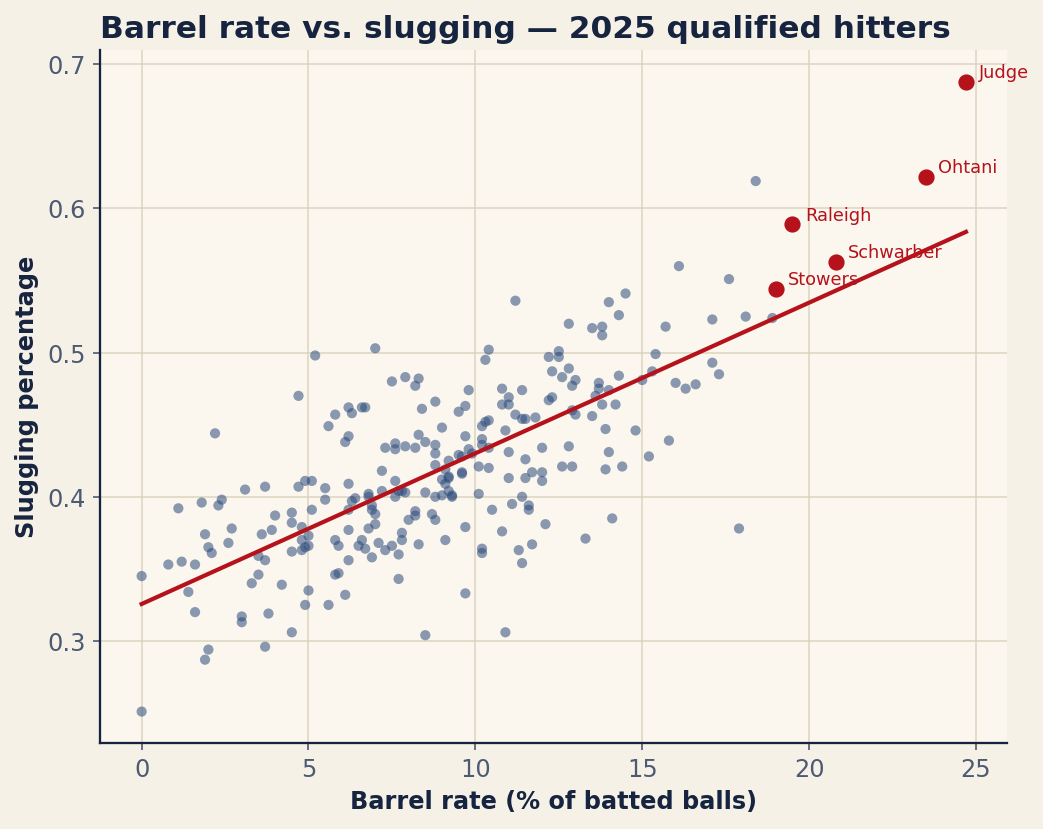
Barrel rate refuses to average. It asks a binary question of every batted ball — did this one land in the velocity-and-angle zone that produces extra-base hits, yes or no — and then counts the yeses. Because it captures the combination rather than the central tendency, it tracks power far more tightly than raw EV does. The relationship is striking in the data: across 2025 qualified hitters, barrel rate and slugging percentage carry a correlation of 0.73. For a single batted-ball metric predicting an outcome stat, that is a strong signal, and it is why barrel rate has become the first number scouts and analysts check when they want to know whether power is real or a mirage.
Barrel/BBE vs. Barrel/PA
Here is the distinction that trips people up, and it matters. Barrel rate comes in two flavors, and they answer different questions.
Barrel/BBE — barrels per batted-ball event — is the rate among balls the hitter actually put in play. It measures pure contact quality: when this hitter connects, how often is it elite? It ignores strikeouts and walks entirely, because those are not batted balls. This is the number you want when judging the raw quality of a swing.
Barrel/PA — barrels per plate appearance — spreads those same barrels across every trip to the plate, strikeouts included. It rewards a hitter for making contact in the first place and penalizes the all-or-nothing slugger who barrels everything he touches but touches very little. A high-strikeout masher can have a gaudy Barrel/BBE and a much more ordinary Barrel/PA, and the gap between the two is a tidy summary of his contact problem. When people quote “barrel rate” without qualification, they usually mean Barrel/BBE — including the leaderboard below — but always check which denominator you are looking at.
Reading the 2025 leaders
The barrel-rate leaderboard reads like a power ranking, which is the point.
| Player | BBE | Avg EV | Barrel% | SLG | xSLG |
|---|---|---|---|---|---|
| Aaron Judge | 388 | 95.4 | 24.7 | 0.688 | 0.708 |
| Shohei Ohtani | 426 | 94.9 | 23.5 | 0.622 | 0.649 |
| Kyle Schwarber | 408 | 94.3 | 20.8 | 0.563 | 0.581 |
| Cal Raleigh | 411 | 91.3 | 19.5 | 0.589 | 0.547 |
| Kyle Stowers | 279 | 91.1 | 19.0 | 0.544 | 0.537 |
| Pete Alonso | 471 | 93.5 | 18.9 | 0.524 | 0.572 |
| Nick Kurtz | 272 | 92.7 | 18.4 | 0.619 | 0.537 |
| Juan Soto | 447 | 93.8 | 18.1 | 0.525 | 0.608 |
| Oneil Cruz | 302 | 95.8 | 17.9 | 0.378 | 0.425 |
| Byron Buxton | 346 | 92.5 | 17.6 | 0.551 | 0.514 |
| Jo Adell | 376 | 91.7 | 17.3 | 0.485 | 0.549 |
| Michael Busch | 387 | 92.2 | 17.1 | 0.523 | 0.548 |
Aaron Judge tops it at a 24.7% barrel rate — nearly a quarter of every ball he put in play met the .500/1.500 standard — paired, unsurprisingly, with a league-leading .688 slugging. Shohei Ohtani follows at 23.5%, then a tier of high-end power bats: Kyle Schwarber at 20.8%, Cal Raleigh at 19.5%, Kyle Stowers at 19.0%. Run your eye down the Barrel% column and then the SLG column and the 0.73 correlation stops being abstract — the two move together almost line for line.
Nearly one in four balls Aaron Judge put in play in 2025 was a barrel. The slugging percentage was not an accident.
The mismatches are where it gets interesting. Look at Oneil Cruz: a 17.9% barrel rate — genuinely elite, top-ten on this board — sitting next to a .378 slugging that looks like a utility infielder’s. That gap is the tell. A hitter barreling the ball that often “should” be slugging far higher, and his .425 xSLG agrees the contact deserved more; the surface number lagged the input. Barrel rate flagged the disconnect before the outcomes caught up — which is exactly the predictive job it is built for.
How to use it — and its limits
Treat barrel rate as a leading indicator of power, not a verdict on a season. Because it measures the input — the quality of contact — rather than the noisy output, it stabilizes faster than slugging and points at where slugging is headed. A hitter whose barrel rate jumps while his slugging stays flat is a breakout waiting to be priced in; one slugging well above what a thin barrel rate supports is a regression candidate.
Two honest caveats. First, mind the denominator, as above — an impressive Barrel/BBE can hide a strikeout problem that Barrel/PA exposes. Second, barrel rate is a power metric, full stop. It says nothing about plate discipline, contact frequency, or speed, and a player can run an elite barrel rate while striking out his way to a mediocre overall line. It is the best public answer to “is the power real?” — not to “is the hitter good?”
The bottom line
Raw exit velocity tells you a hitter is strong. Barrel rate tells you whether that strength is aimed at the angles that actually produce extra-base hits, and it does so by counting the exact batted balls — at least 98 mph, at the launch angle that historically yields a .500 average and 1.500 slugging — that turn into damage. With a 0.73 correlation to slugging and a leaderboard that doubles as a power ranking, it is the first number to check when you want to know if the thunder is real. Aaron Judge’s 24.7% says some of it very much is.
Sources & Further Reading
- Barrel-rate leaders and batted-ball data: Baseball Savant (Statcast leaderboards, 2025 qualified hitters). Numbers retrieved June 2026; computed for this article from that source.
- MLB.com — the official Statcast glossary, including the barrel definition and launch-angle windows.
- Baseball Savant expected-statistics leaderboard, for the xSLG comparisons.