“Best shape of his life.” “Raking in Arizona.” “He’s finally figured it out.” March hands the baseball internet a fresh crop of these headlines every year, and the gaudy spring batting lines underneath them make the temptation to read March as a preview almost irresistible. The data, unfortunately, keeps refusing to cooperate.
We pulled the 2025 numbers to put a figure on it. The question is narrow and answerable: if you know a hitter’s spring-training OPS, how much does that tell you about the OPS he’ll post once the season counts? The short version is “almost nothing.” The longer version is more interesting, because the parts of spring that don’t show up in a batting line are exactly the parts worth watching.
What we measured
We took every hitter with a meaningful sample in both halves of 2025 — at least 30 spring-training plate appearances and at least 250 regular-season plate appearances — and matched each player’s spring OPS against his regular-season OPS. That left 275 players, a healthy sample of real big-leaguers rather than a handful of cherry-picked names. Then we did the most basic thing you can do with two columns of numbers: ask how tightly they move together.
OPS is the right yardstick for this because it’s available, comparable across the two halves, and rolls power and on-base skill into one figure. If spring performance carried a real signal about regular-season hitting, these two columns would rise and fall in tandem, and the scatter would hug a line. It doesn’t.
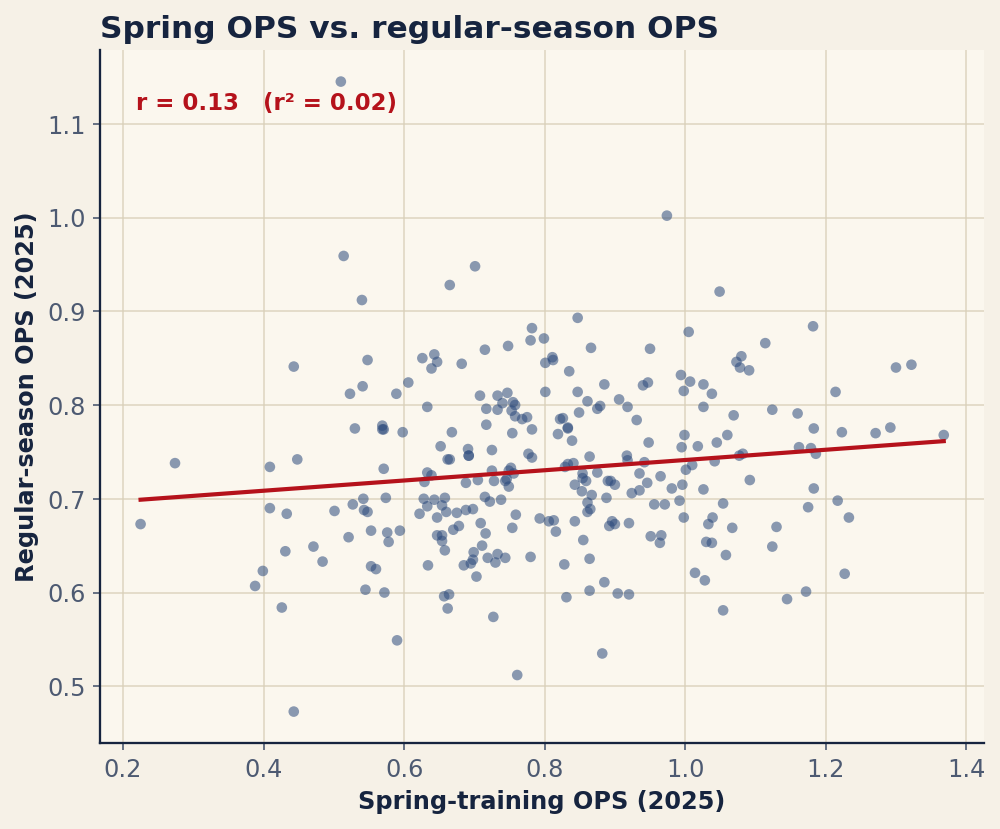
A correlation of basically zero
Here is the whole story in three numbers. Across those 275 hitters, the correlation between spring OPS and regular-season OPS was r ≈ 0.13. Squared, that’s an r² of about 0.02 — meaning spring OPS explains roughly 2% of the variation in regular-season OPS. The fitted slope is a flat 0.05: drag a hitter’s spring OPS up by a hundred points and the line predicts his regular-season OPS rises by all of five. The cloud of dots in the figure is exactly what near-zero correlation looks like — a shapeless blob, not a trend.
To be clear about what 2% means: ninety-eight percent of what determines a hitter’s real-season OPS has nothing to do with how he hit in spring. A loud March and a quiet March end up in the same place often enough that the spring line is, for forecasting purposes, noise. This isn’t a contrarian take; it’s the long-standing consensus in baseball research, and our 2025 result lands right where decades of that work would predict.
Spring OPS explains about 2% of regular-season OPS. The other 98% shows up after Opening Day.
Why the signal is so weak
Once you look at how spring statistics are generated, a near-zero correlation stops being surprising and starts being inevitable. Several forces conspire to drown out whatever signal exists.
The samples are tiny. Thirty or forty spring at-bats is statistical confetti. Even in the regular season it takes hundreds of plate appearances for a hitter’s OPS to mean much; a month of spring is far short of that. A 2-for-4 day moves a March line dramatically and tells you essentially nothing.
The competition is wildly uneven. This is the big one, and it’s unique to spring. A regular might face a future Cy Young winner in one at-bat and a Double-A arm padding his innings in the next. Non-roster invitees and minor-leaguers fill out both lineups and pitching staffs, so a hitter’s spring OPS is partly a function of who happened to be standing on the mound. There is no comparable distortion once the season starts.
Players aren’t trying to win. Spring is a laboratory, not a competition. A hitter may spend two weeks deliberately working on hitting the ball the other way, or seeing as many pitches as possible, or testing a leg kick — all of which can tank his batting line while accomplishing precisely what he set out to do. Pitchers, likewise, throw their fourth-best pitch on purpose to develop it. The scoreboard is measuring intentions you can’t see.
The environment is noisy. Desert air, daytime heat, unfamiliar small ballparks, and shifting wind all push offense around in ways that have nothing to do with the hitter. Add selection effects — the players who get the most spring at-bats aren’t a random sample — and the few percent of real signal gets buried.
What actually carries meaning out of spring
None of this means spring training is information-free. It means the batting line is the wrong place to look. The signal lives in things that are measurable, physical, or structural — changes in capability rather than results against scattered competition.
A genuine velocity jump. If a pitcher is sitting two or three miles per hour above last year’s fastball and holding it across multiple outings, that’s real and it tends to stick, because velocity is a stable physical trait, not a small-sample fluke. The radar gun in March is far more predictive than the ERA next to it.
A new pitch. A pitcher unveiling a sweeper or a splitter he didn’t have last season is changing his actual arsenal. Whether it works is an open question, but the fact of a new weapon is information you can carry into April — unlike his spring strikeout total.
A role or playing-time decision. The most reliably predictive thing about spring has nothing to do with performance at all: it’s who makes the roster and how they’ll be used. A player winning the everyday job, a prospect breaking camp, a reliever being stretched into a starter — these are decisions, and decisions about playing time shape a season far more than a hot week of exhibition games.
A clean return from injury. A hitter who missed last year and is now running, swinging freely, and playing the field without restriction is offering real news about his health. The fact that he’s out there at full speed matters; his March slugging percentage does not.
Notice the pattern. Everything on this list is a change in ability or circumstance — velocity, arsenal, role, health. Everything that washed out in our correlation was a change in results against a chaotic mix of opponents. Spring rewards watching how players look and what teams decide, and punishes anyone who treats the leaderboard as a forecast.
The bottom line
A great spring batting line is the baseball equivalent of a preseason highlight reel: fun, occasionally beautiful, and almost useless as prediction. Our 2025 numbers put it plainly — with 275 hitters in the sample, spring OPS and regular-season OPS correlate at about 0.13, which is to say they barely correlate at all, and spring explains a measly 2% of what a hitter does when it counts. So enjoy March for what it is, and aim your attention at the things that survive the noise: a fastball that gained a tick, a new pitch in the mix, a job won, a body finally healthy. Those are the spring stories worth believing. The .950 spring OPS is not one of them.
Sources & Further Reading
- Chapter 22: Correlation and Simple Linear Regression covers the foundations; it’s free to read at DataField.dev.
- Spring vs. regular-season hitting: MLB.com (MLB Stats API, 2025 spring and regular-season splits). Data retrieved June 2026; re-runnable via
scripts/spring_training.py. - FanGraphs — on stat reliability and how many plate appearances a number needs before it stabilizes.
- Society for American Baseball Research (SABR) — the broader research literature on spring training as a predictor.