Watch a hitter ride a .330 average through May and you’ll hear two competing explanations. One camp says he’s figured something out; the other says he’s getting lucky and the bottom is about to fall out. BABIP — Batting Average on Balls In Play — is the number that referees that argument. It looks only at what happens when a batter puts the ball in the field of play, strips out strikeouts and home runs, and asks a single blunt question: when this player makes the defense field a ball, how often does it fall in for a hit?
The answer turns out to be far more stable, and far more revealing, than raw batting average. BABIP is the first place a sharp analyst looks to separate the hitters who earned their line from the ones who are about to give it back.
What BABIP measures
Batting average counts every plate appearance that ends in a hit over every official at-bat. BABIP deliberately narrows the lens. It removes the three outcomes that don’t involve a defender at all — strikeouts, walks, and home runs — and measures only the batted balls a fielder actually has a chance to convert into an out. The formula is short:
Interactive tool
BABIP Calculator
Batting Average on Balls In Play, to separate luck from skill and flag regression candidates. This interactive calculator needs JavaScript; the formula and explanation above work without it.
The numerator is hits that stayed in the park: total hits minus home runs. The denominator is at-bats that ended with a ball in play: at-bats minus strikeouts minus home runs, plus sacrifice flies (which don’t count as at-bats but absolutely were balls in play that a fielder caught). Everything left over is the population of batted balls whose fate the defense, the field, and a fair amount of luck decided.
Why ~.300 is the anchor
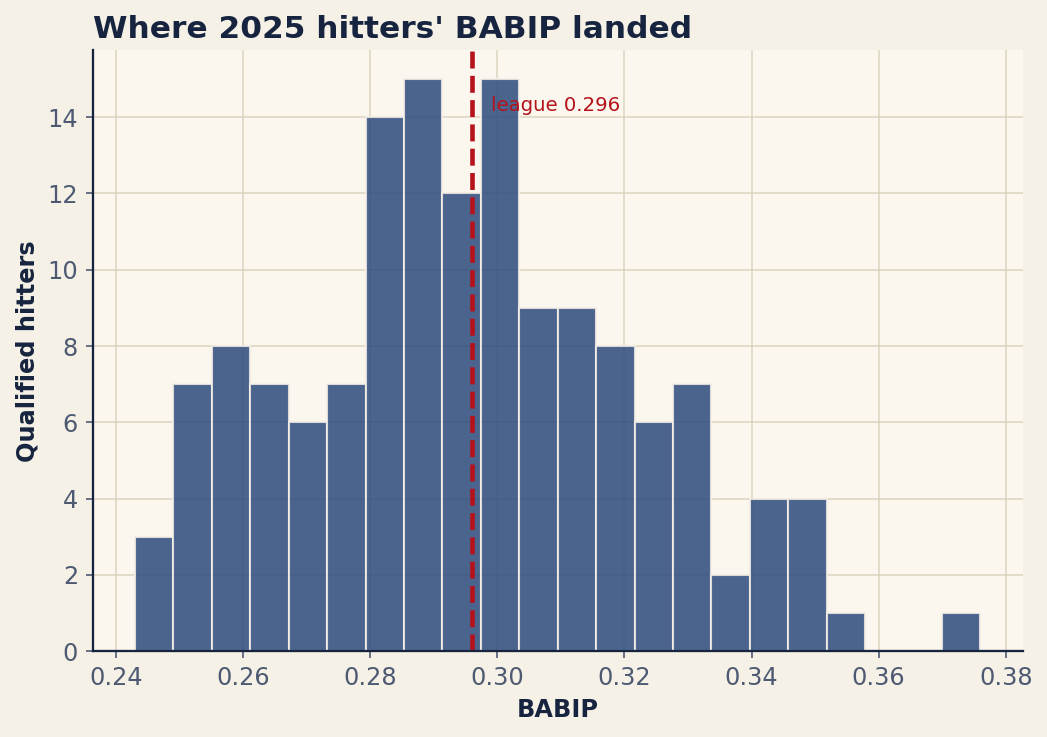
Across the league, BABIP clusters tightly around the .300 mark, year after year, far more tightly than batting average does. In 2025 the qualified-hitter league average was .296, and that figure barely moves season to season. The reason is structural: once a ball is in play, an enormous amount of what happens next is outside the hitter’s control. He can influence how hard and at what angle he hits it, but he cannot choose whether the shortstop was shaded three steps the right way, whether the liner found the gap or the glove, or whether the turf played fast that night.
That stability is exactly what makes BABIP useful. When a single hitter’s mark drifts well above or below the .300 neighborhood, the league baseline gives you a gravitational center to measure against. The figure below plots every qualified hitter in 2025 against that dashed league line, and the shape is the point: a dense pile in the .290–.320 band with a handful of names stretched out at either edge.
The leaderboard, top and bottom
The table collects the highest and lowest qualified BABIP marks of 2025. At the top sits Aaron Judge at a remarkable .376 — eighty points clear of league average. At the bottom is Eugenio Suárez at .243, a full half-season of bad luck and pulled-into-the-shift fly balls rolled into one line.
| Player | AVG | BABIP | K% |
|---|---|---|---|
| Aaron Judge | 0.331 | 0.376 | 23.6 |
| Brice Turang | 0.288 | 0.356 | 22.8 |
| Gavin Lux | 0.269 | 0.351 | 22.7 |
| Jordan Beck | 0.258 | 0.351 | 29.6 |
| Trea Turner | 0.304 | 0.35 | 16.7 |
| James Wood | 0.256 | 0.35 | 32.1 |
| Jeremy Peña | 0.304 | 0.345 | 17.1 |
| Bo Bichette | 0.311 | 0.342 | 14.5 |
| Freddie Freeman | 0.295 | 0.342 | 20.4 |
| George Springer | 0.309 | 0.34 | 18.9 |
| Lourdes Gurriel Jr. | 0.248 | 0.254 | 13.9 |
| Kyle Schwarber | 0.24 | 0.253 | 27.2 |
| Trent Grisham | 0.235 | 0.253 | 23.6 |
| Agustín Ramírez | 0.231 | 0.253 | 19.3 |
| Anthony Volpe | 0.212 | 0.252 | 25.2 |
| Salvador Perez | 0.236 | 0.251 | 19.5 |
| Marcus Semien | 0.23 | 0.251 | 17.4 |
| Cal Raleigh | 0.247 | 0.248 | 26.7 |
| Josh Bell | 0.237 | 0.247 | 16.5 |
| Eugenio Suárez | 0.228 | 0.243 | 29.8 |
Here is where BABIP earns its keep, because the two ends of this table are not the same kind of player. Judge’s .376 is not a coin flip that landed his way; it is the fingerprint of contact so violent that defenders simply cannot convert it. Suárez’s .243, paired with a 29.8% strikeout rate, is the signature of a pull-heavy slugger whose batted balls are easy to defend and whose hits, when they come, tend to clear the fence rather than drop in. Notice that several of the lowest marks — Kyle Schwarber at .253, Cal Raleigh at .248 — belong to genuinely excellent hitters. Low BABIP is not the same as bad. It is a clue, not a verdict.
Skill at the top, luck in the middle
So which high BABIPs are real and which evaporate? The honest answer is that a high mark is some blend of both, and the analyst’s job is to estimate the mix. Three things drive a BABIP that is genuinely earned and will largely stick.
The first is contact quality. A hitter who consistently squares the ball up — high exit velocity, a steady diet of barrels — generates more hits per ball in play because hard-hit balls find grass more often and turn defenders into spectators. Judge is the cleanest example in the game: his BABIP is high because the physics of his contact make it high. The second is line-drive rate. Line drives fall for hits at a vastly higher clip than ground balls or fly balls, so a hitter who lives on a flat, hard plane will sustain an above-average BABIP almost by construction. The third is raw speed. A burner beats out infield choppers and stretches would-be outs into singles, nudging his BABIP up in a way that shows up every season rather than washing out.
What regresses is everything that isn’t one of those. A career .300-BABIP hitter sitting at .350 in June with pedestrian exit velocity and an ordinary line-drive rate is not enjoying a new skill; he is enjoying a hot streak of seeing-eye singles, and the cluster luck will fade back toward his established level. The tell is always the gap between the BABIP and the batted-ball profile underneath it. When the profile justifies the number, believe it. When it doesn’t, set a timer.
Pitchers regress harder than hitters
BABIP’s most famous insight belongs to the pitching side, and it is more extreme there. The original research behind Defense-Independent Pitching showed that pitchers exert startlingly little control over their BABIP-against. A pitcher controls strikeouts, walks, and to a meaningful degree home runs — but once a batter puts the ball in play, the outcome is mostly the defense’s problem and the schedule’s luck. Major-league pitchers, as a group, allow a BABIP that hovers near .290–.300 essentially regardless of who is throwing.
The practical consequence is that a pitcher with a shiny ERA propped up by a .250 BABIP-against is a regression candidate flashing red, while one buried by a .340 BABIP-against is probably better than his results. Hitters retain more control over their batted-ball luck than pitchers do — the skill component is real and persistent for the bat — but for arms, BABIP-against should be treated as noise first and signal second until a long track record proves otherwise. That asymmetry is the entire reason FIP and xFIP exist.
Using BABIP as a regression flag
None of this makes BABIP a standalone verdict, and it was never meant to be one. Its job is to raise a hand. The workflow is simple: when a hitter’s surface line looks out of step with his history, check his BABIP against both the .296 league anchor and his own career norm. A large gap says “this line is unstable — find out why.”
Then you go looking for the why, and that is where expected stats take over. If a hitter’s BABIP is sky-high but his expected batting average and xwOBA are climbing right alongside it, the contact is real and the BABIP is earned. If the BABIP has run off and the expected numbers stayed home, you are watching luck that the schedule will reclaim. BABIP tells you something is off; the Statcast expected metrics tell you which direction it will correct. The same logic underwrites wOBA versus xwOBA — done versus deserved — with BABIP serving as the quick, back-of-the-envelope version you can compute from a standard box score.
The bottom line
BABIP answers a question batting average can’t: of the balls this player actually made the defense field, how many fell in — and is that rate something he built or something he borrowed? Around .296 is the league’s center of gravity. Drift far from it and you have a hitter worth a second look, an ERA worth doubting, or a breakout worth believing. Read it next to hard-hit data and expected stats and BABIP becomes one of the most efficient early-warning systems in the sport — a single ratio that tells you whether a hot start is the real thing or a check the schedule is about to cash.
Sources & Further Reading
- Chapter 6: Numerical Summaries: Center, Spread, and Shape covers the foundations; it’s free to read at DataField.dev.
- Leaderboard and league data: MLB.com (MLB Stats API hitting totals, BABIP computed). Numbers retrieved June 2026; re-runnable via
scripts/babip_leaders.py. - FanGraphs — BABIP library entry and the original Defense-Independent Pitching research on pitcher BABIP regression.
- Baseball Savant — Statcast batted-ball and expected-statistics leaderboards for checking whether a BABIP is earned.