Slugging percentage has a problem it never advertises: a team full of singles hitters and a team full of doubles-and-homers sluggers can post the same slugging figure if the singles pile up high enough. Slugging counts total bases, and a single is a base. So it quietly rewards contact that has nothing to do with power. Isolated Power — ISO — is the one-line fix. Subtract batting average from slugging and every single cancels out, leaving only the extra bases: the doubles, triples, and home runs. What’s left is the cleanest simple number we have for raw power.
Here is the claim we’ll defend with the 2024 data: ISO does exactly what it promises, tracking home-run output almost perfectly across teams — and that is also its limit. Power is a real, separable skill, but it is not the whole of scoring, and a stat built to isolate one ingredient shouldn’t be mistaken for a measure of offense. ISO is a scalpel, not a Swiss army knife.
The formula, and why the subtraction matters
Isolated Power is about as simple as a derived stat gets. You take slugging percentage — total bases per at-bat — and subtract batting average — hits per at-bat. Because every hit is worth at least one base, that one guaranteed base per hit is precisely what batting average measures, so subtracting it strips the “you reached on a hit” credit and leaves only the bases beyond first.
Read the collapsed right-hand side and the whole point jumps out: singles have vanished entirely. A double is worth one unit of ISO, a triple two, a home run three. It is the average number of extra bases a hitter racks up per at-bat. A player who hits .300 on nothing but singles has an ISO of exactly zero — correctly, because he has no power — while a three-true-outcomes slugger hitting .230 with 40 homers can post an ISO north of .250. The scale runs roughly from about .100 (punchless) to .200 (real thump) to .250-plus (elite), with the league typically sitting around .150 to .160.
The 2024 team leaderboard
Here is every team’s 2024 ISO, computed straight from published slugging and batting average. We’ve put the top and bottom of the league side by side because the gap is the story: the most powerful lineup out-ISO’d the least powerful by about seventy points, which is an enormous spread for a rate stat.
| Team | AVG | SLG | ISO | HR | Runs |
|---|---|---|---|---|---|
| Dodgers | .258 | .446 | .188 | 233 | 842 |
| Orioles | .250 | .435 | .185 | 235 | 786 |
| Yankees | .248 | .429 | .181 | 237 | 815 |
| D-backs | .263 | .440 | .177 | 211 | 886 |
| Braves | .243 | .415 | .172 | 213 | 704 |
| Red Sox | .252 | .423 | .171 | 194 | 751 |
| … league average ISO ≈ .156 … | |||||
| Pirates | .234 | .371 | .137 | 160 | 665 |
| Rays | .230 | .366 | .136 | 147 | 604 |
| Marlins | .244 | .378 | .134 | 150 | 637 |
| Nationals | .243 | .375 | .132 | 135 | 660 |
| White Sox | .221 | .340 | .119 | 133 | 507 |
The Dodgers led baseball at .188, the White Sox trailed at .119, and the league sat around .156. Notice something the table half-hides: ISO order is not the same as batting-average order. The D-backs hit .263 — a better average than any of the teams above them — yet ranked fourth in power, because a chunk of their contact was singles. That divergence is ISO earning its keep. Batting average was calling the D-backs a better-hitting team than the Braves; ISO correctly says the Braves had more pop, even while making more outs.
How tightly ISO tracks power — and scoring
Run the correlations across all 30 teams and the picture is sharp. Team ISO lines up with team home runs at r = 0.95 — an almost mechanical relationship, which makes sense, since homers are the biggest term in the ISO numerator. If you want a single rate stat that says “this lineup hits for power,” ISO is it, and it barely disagrees with a raw homer count.
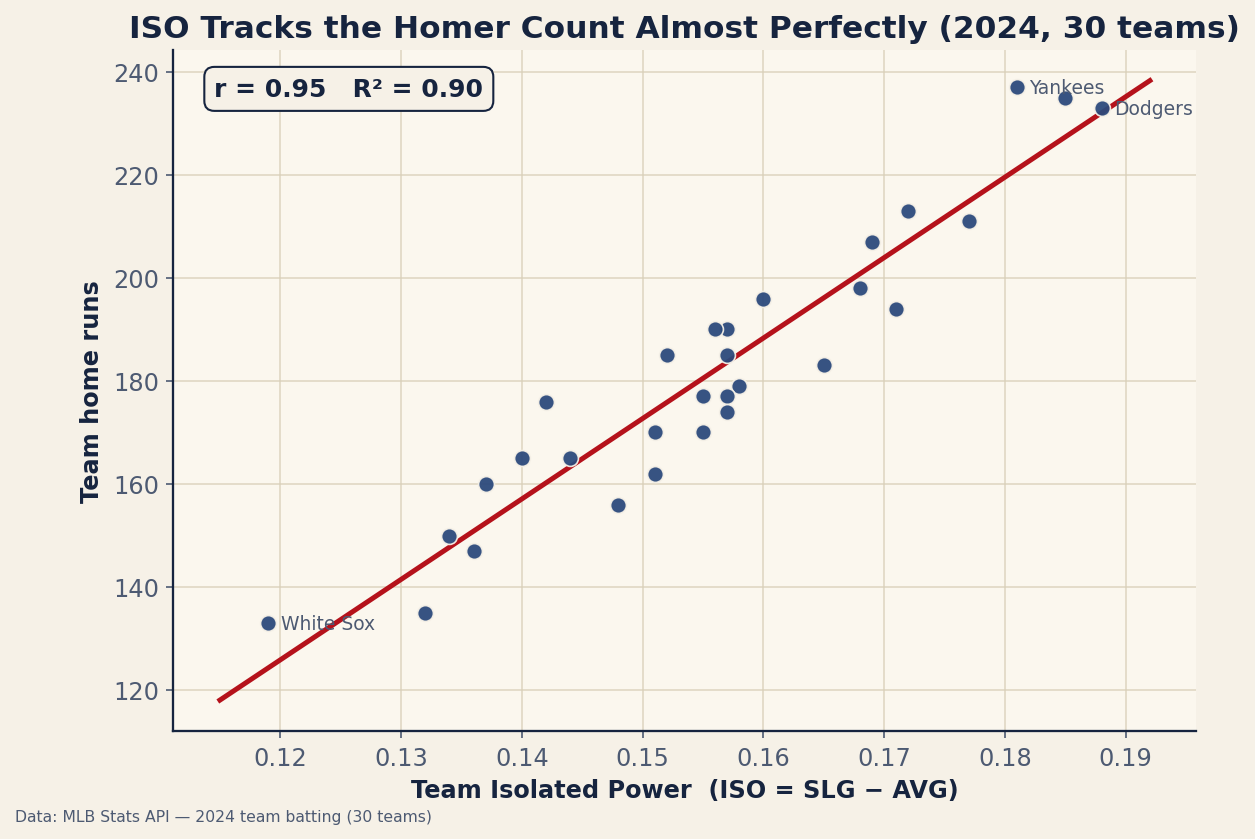
But then push one step further, to the thing that actually wins games — runs — and ISO’s grip loosens. Here is where each hitting number lands against 2024 team scoring:
| Stat | r with runs | R² |
|---|---|---|
| OPS | 0.96 | 0.92 |
| Slugging (SLG) | 0.93 | 0.86 |
| Isolated Power (ISO) | 0.86 | 0.73 |
| Batting average (AVG) | 0.80 | 0.64 |
| Home runs (HR) | 0.79 | 0.62 |
ISO (0.86) beats batting average (0.80) and even raw home runs (0.79) as a predictor of scoring — power really does matter more than punchless contact. But it sits behind slugging (0.93) and well behind OPS (0.96). The reason is exactly what ISO throws away: by design it ignores the singles and, more importantly, it ignores getting on base at all. Slugging keeps the singles; OPS adds on-base percentage on top. Both restore the part of offense ISO deliberately amputated. ISO answers “how hard does this team hit the ball for distance,” not “how many runs does this team score,” and the 2024 numbers keep those two questions honestly apart. This is the same lesson as our look at how much the home run drives scoring and at which hitting stat predicts winning: power is a big piece, on-base is a bigger one.
A worked example: two lineups, same slugging
Take the divergence out of the abstract. In 2024 the Padres and the Braves posted nearly the same slugging on very different profiles. San Diego hit .263/.420 for an ISO of .157; Atlanta hit .243/.415 for an ISO of .172. The Padres’ slugging was actually a touch higher, yet the Braves had clearly more power — because the Padres inflated their slugging with a high batting average (all those singles carry one base each into SLG), while the Braves got their slugging from extra-base damage despite making more outs.
Padres:  SLG .420 − AVG .263 = ISO .157
Braves:  SLG .415 − AVG .243 = ISO .172
Slugging said the Padres hit for slightly more total-base value. ISO said the Braves hit for more power. Both are true, and they are different sentences. That is the entire reason ISO exists: to answer the second question without letting the first one contaminate it. If you only ever looked at slugging you’d have called these two lineups near-identical sluggers; ISO tells you one of them was living on singles.
Where ISO breaks down
We like ISO, but it is narrow on purpose, and pretending otherwise is where people misuse it. A few honest limits:
- It says nothing about getting on base. A .250-ISO hitter who never walks and hits .200 can be a below-average hitter overall, because power with no on-base is a lot of empty swings. ISO is one axis of hitting, not a verdict. For the on-base axis, see BABIP and the broader expected-stats family.
- It’s unadjusted for park and league. Coors Field inflates extra-base hits; a pitcher-friendly yard suppresses them. A raw ISO in Colorado is not the same power as the identical figure in a canyon, which is exactly the distortion park factors exist to remove. The team figures above are all unadjusted.
- It weights the extra bases linearly, which isn’t quite right. ISO treats a home run as worth exactly three doubles’ worth of power (3 units vs. 1), but in actual run value a homer is worth more than three doubles are. The proper run weights come from linear weights, which is why wOBA and wRC+ are better value stats. ISO is a descriptive power gauge, not a run estimator.
- Contact quality is invisible. Two hitters with the same ISO can get there through very different batted-ball profiles; for the underlying “is this power real,” barrel rate and exit velocity are the more direct tools.
The bottom line
Isolated Power is the rare derived stat you can reconstruct in your head: slugging minus average, which cancels the singles and leaves the extra bases — the doubles, triples, and homers that are the actual signature of power. The 2024 teams confirm it does its one job cleanly, tracking home runs at r = 0.95, and they also mark its boundary: at r = 0.86 with runs it trails slugging and OPS, because it deliberately ignores the on-base skill that scoring depends on. Use ISO when the question is “how much raw pop does this bat have,” and reach for OPS, wOBA, or wRC+ the moment the question becomes “how good a hitter is he.” The number is honest as long as you don’t ask it to be something it isn’t.
Reproduce it
Every figure here comes from the bundled data_layer/team_batting_2024.json (AVG/SLG/HR/runs for all 30 teams, MLB Stats API, retrieved 2026-06-22). ISO is SLG − AVG per team; the correlations are corr(ISO, HR), corr(ISO, runs), and the same against SLG, OPS, AVG, and HR. No network, nothing hand-entered.
Sources & Further Reading
- 2024 team batting (AVG/SLG/HR/runs): bundled
data_layer/team_batting_2024.json, pulled from the MLB Stats API (retrieved 2026-06-22). - FanGraphs Library — the standard reference on Isolated Power, its scale, and its uses.
- Branch Rickey and Allan Roth popularized isolating power from average in the 1950s; the modern ISO formulation runs through Baseball-Reference and Bill James’s Baseball Abstract work.
- Related: Which hitting stat predicts winning and how much the home run drives scoring — where power sits in the bigger offensive picture.