Earned run average is the oldest number we still trust, and it carries a quiet editorial decision inside it that nobody voted on: some of the runs a pitching staff allows simply don’t count. If a shortstop boots a grounder and the next batter homers, two runs cross the plate, the scoreboard moves, the team can lose the game — and ERA pretends one or both of those runs never happened, because an official scorer ruled they were “unearned.” ERA is not runs allowed. It is runs allowed minus the ones we’ve decided to forgive.
Here is the finding, measured on all 30 teams in 2024: that forgiveness is not a rounding error. The average team’s actual runs allowed per nine innings ran 0.38 above its ERA — roughly 61 runs a season that hit the standings but never touched the pitcher’s ledger, about one run in twelve wiped from the record. And when you ask which number better tracks winning, the un-forgiving one wins: total runs allowed correlated with team winning percentage a touch more tightly than ERA did. The runs ERA throws away still counted where it mattered.
What “earned” actually means
The distinction is a bookkeeping rule, not a physics one. A run is unearned if it scored only because of an error or a passed ball — if, in the official scorer’s reconstruction of the inning, the defense should have been out of the inning already had it fielded cleanly. Errors erase the run from ERA. So does the ripple effect: if an error extends an inning, subsequent runs in that inning can also be ruled unearned, on the theory that the inning “should” have been over.
ERA, then, is earned runs scaled to a nine-inning rate. Its honest sibling is RA/9 — all runs allowed, earned and unearned alike, on the same per-nine scale. The gap between them is the unearned-run tax:
The philosophical case for ERA is that a pitcher shouldn’t be blamed for his defense’s clank. Fair enough — that instinct is the seed of every defense-independent metric we have. But notice the sleight of hand: ERA doesn’t reassign the unearned run to the fielder who booted it. It just deletes the run from everyone’s account. The run scored. Somebody allowed it. ERA’s answer is “not my department.”
The 2024 audit: how big is the tax?
Across the 30 teams, the average gap between RA/9 and ERA was 0.38 runs per nine, which works out to about 61 unearned runs per team over a full season — roughly 8.6% of all runs allowed. But the tax was far from uniform. Some staffs (really, some defenses) leaked a lot more unearned runs than others:
| Team | ERA | RA/9 | Gap | Runs allowed |
|---|---|---|---|---|
| Red Sox | 4.04 | 4.63 | 0.59 | 747 |
| Marlins | 4.73 | 5.27 | 0.54 | 841 |
| Nationals | 4.30 | 4.79 | 0.49 | 764 |
| White Sox | 4.67 | 5.15 | 0.48 | 813 |
| Pirates | 4.15 | 4.62 | 0.47 | 739 |
| … league average gap ≈ 0.38 … | ||||
| Diamondbacks | 4.62 | 4.91 | 0.29 | 788 |
| Giants | 4.10 | 4.39 | 0.29 | 699 |
| Reds | 4.09 | 4.37 | 0.28 | 694 |
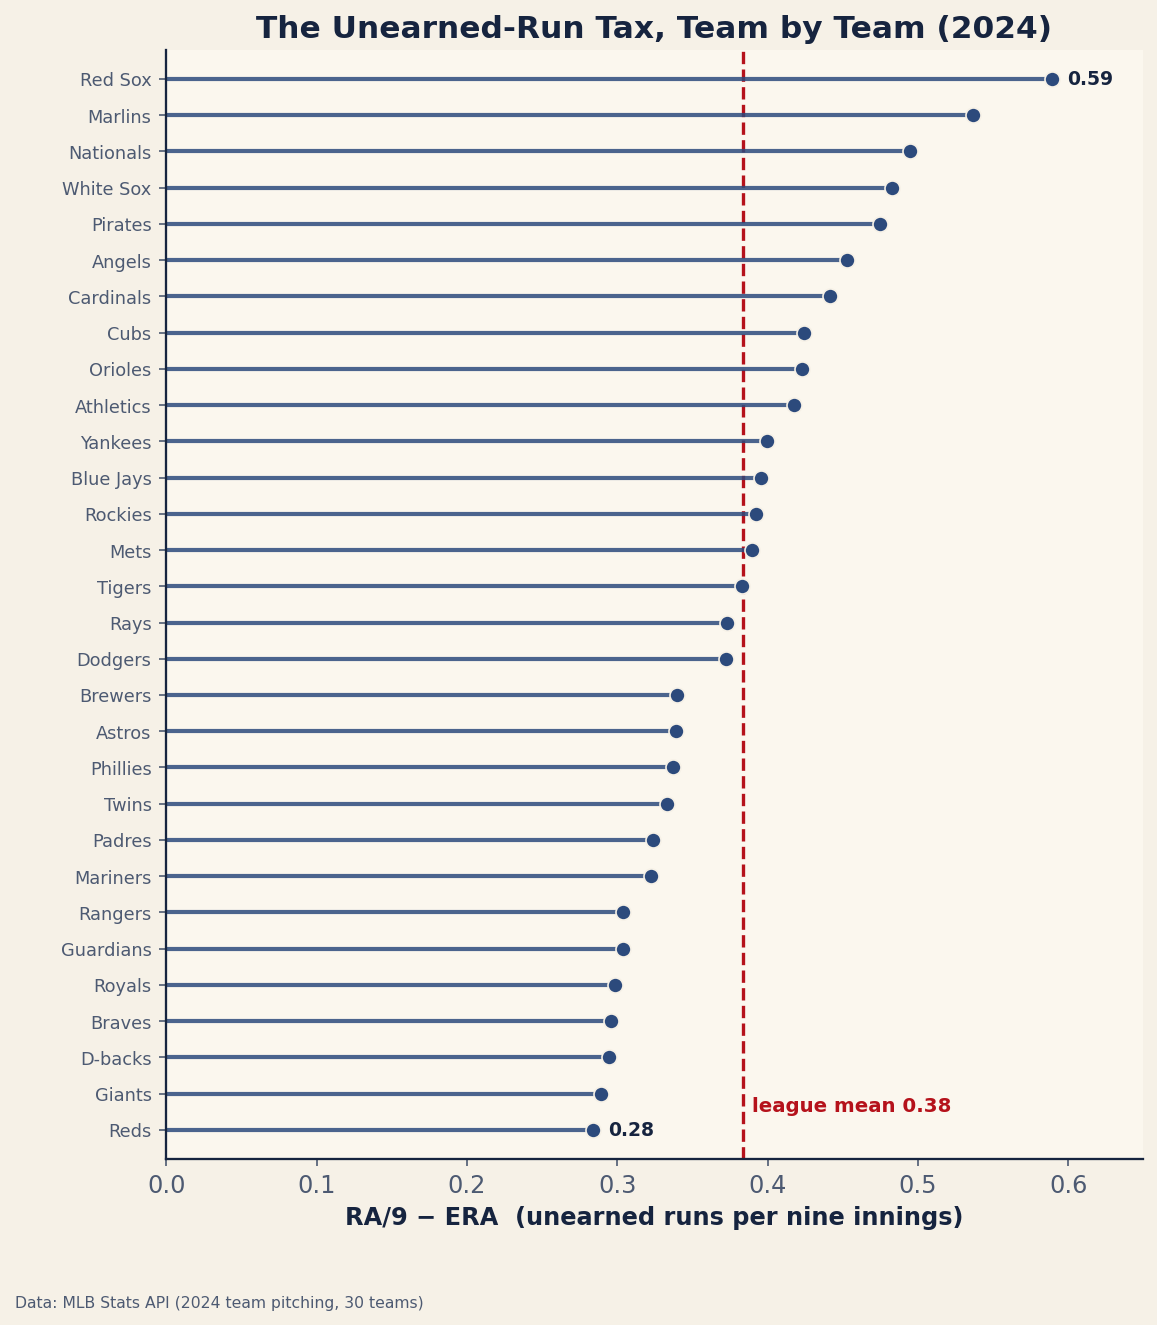
The Red Sox topped the league at a 0.59 gap — about 95 unearned runs on the season, the most in baseball — while the Reds bottomed out near 0.28 and about 45. That spread of fifty unearned runs between the leakiest and tightest teams is roughly five wins’ worth of runs, all of it invisible to ERA. And it is not random noise sprinkled evenly: unearned runs cluster on the teams whose defenses commit and compound errors, which means ERA systematically flatters exactly the pitching staffs that play in front of bad gloves. A staff can post a respectable ERA while its actual run prevention — the thing on the scoreboard — is a good deal worse.
Which number better predicts winning?
If ERA’s deletions were harmless, ERA and total runs allowed would track winning about equally. They don’t — and the un-forgiving number edges ahead. Correlated against 2024 team winning percentage:
| Stat | r with win% | R² |
|---|---|---|
| RA/9 (all runs allowed) | −0.77 | 0.59 |
| Runs allowed (season total) | −0.75 | 0.56 |
| ERA (earned only) | −0.74 | 0.54 |
The signs are negative because allowing more runs goes with winning less; it’s the magnitudes that matter. RA/9 (0.77) beats ERA (0.74). It’s a small edge — four hundredths — but it points the right way and for the right reason: winning depends on all the runs you allow, and ERA is throwing roughly one in twelve of them out before the correlation is even run. Counting the runs the standings actually counted predicts the standings slightly better. Who knew.
Now the honest counterweight, because we don’t want to oversell four hundredths. ERA and RA/9 agree with each other at r = 0.99 across the 30 teams. Unearned runs are a small, fairly consistent tax, so a team’s ERA rank and its RA/9 rank are nearly identical. For ranking staffs against each other in a single season, it rarely matters which you pick. The unearned-run distinction is real, and it’s a genuine blind spot, but it is a small blind spot — the kind that changes a team by a few runs, not a tier.
Where this leaves ERA — and what to reach for instead
The unearned-run problem is only the first crack in ERA, and not even the biggest one. ERA’s deeper issue is that even among earned runs, it credits and blames the pitcher for outcomes his defense, his ballpark, and plain sequencing luck largely determined. That is the entire motivation behind the defense-independent family:
- FIP and xFIP ignore balls in play altogether, judging a pitcher on strikeouts, walks, and home runs — the events a defense can’t touch. That’s a cleaner separation of pitcher from fielder than the earned/unearned line, which still runs through an official scorer’s judgment call. See FIP and xFIP explained.
- K-BB% strips it down further to what a pitcher controls one batter at a time, and it travels remarkably well — our look at K-BB% as the stat that travels shows it tracking ERA closely without any defense in it.
- And the reason two sites publish different WAR for the same pitcher is precisely this argument — one build starts from runs allowed, another from FIP — a disagreement about how much of run prevention to hang on the pitcher at all.
The runs an error lets in also raise a fair question about whether the fielder should wear them, which is the territory of DRS and OAA — the metrics that try to charge defense in runs rather than just deleting them from the pitcher.
The bottom line
ERA is a useful, familiar, and slightly dishonest number. It forgives about one run in twelve — roughly 61 a team in 2024, and as many as 95 for the leakiest defense — by ruling those runs unearned and deleting them rather than reassigning them. Because the deleted runs still counted in the standings, total runs allowed (RA/9) predicted 2024 winning a hair better than ERA did, 0.77 to 0.74. The practical caveat is that ERA and RA/9 agree 99% of the time, so this is a blind spot, not a scandal. But it’s a useful reminder of what every earned-run figure quietly assumes: that some of the runs a team gave up don’t belong to anyone. The scoreboard disagrees.
Reproduce it
Every number here comes from the bundled data_layer/team_pitching_2024.json (ERA, runs allowed, IP, and wins for all 30 teams, MLB Stats API, retrieved 2026-06-24). Compute RA/9 = 9 × runs_allowed / IP per team, the gap as RA/9 − ERA, earned runs as ERA × IP / 9, and unearned as the remainder. The predictive check is corr(RA/9, winpct) versus corr(ERA, winpct). No network, nothing hand-entered.
Sources & Further Reading
- 2024 team pitching (ERA/runs allowed/IP): bundled
data_layer/team_pitching_2024.json, pulled from the MLB Stats API (retrieved 2026-06-24). - FanGraphs Library — on ERA, RA/9, and the case for defense-independent pitching stats.
- Baseball-Reference — publishes ERA and RA/9 side by side for every team and pitcher, and its WAR is built on runs allowed rather than earned runs.
- Related: FIP and xFIP, K-BB%, and why WAR differs by site — the metrics that pick up where ERA leaves off.