Pitching stats are noisy because most of them depend on things the pitcher doesn't fully control — the defense behind him, the ballpark, the sequencing luck of when hits cluster. ERA can swing a full run on a few bad-luck bloops. So scouts and analysts keep coming back to one stripped-down number that measures only what a pitcher does to a batter, one at a time: K-BB%, strikeouts minus walks as a share of batters faced. It's almost crude in its simplicity, and it's one of the most reliable things in baseball. Across all 30 teams in 2024, K-BB% explains about 69% of the variance in team ERA — a correlation of −0.83 from a single rate.
What K-BB% is
Take a pitcher's (or a staff's) strikeouts, subtract the walks, and divide by total batters faced. That's it. The logic is that the two most controllable outcomes of any plate appearance — the strikeout and the walk — happen without the defense touching the ball. A strikeout is an out the fielders didn't have to make; a walk is a baserunner they couldn't have prevented. Everything in between — grounders, liners, fly balls — is a coin toss split between the pitcher, his fielders, the park, and luck. K-BB% throws all of that out and keeps the part that's most repeatable, which is exactly why it stabilizes faster and predicts better than ERA itself.
The test
For all 30 teams I lined up the 2024 pitching staffs' K-BB% against their ERA, their total runs allowed, and their winning percentage, and computed the correlation. K-BB% ranges from about 8.8% (the worst staff) to 18.5% (the best) — a wide spread, and almost all of it shows up in run prevention.
The exhibit
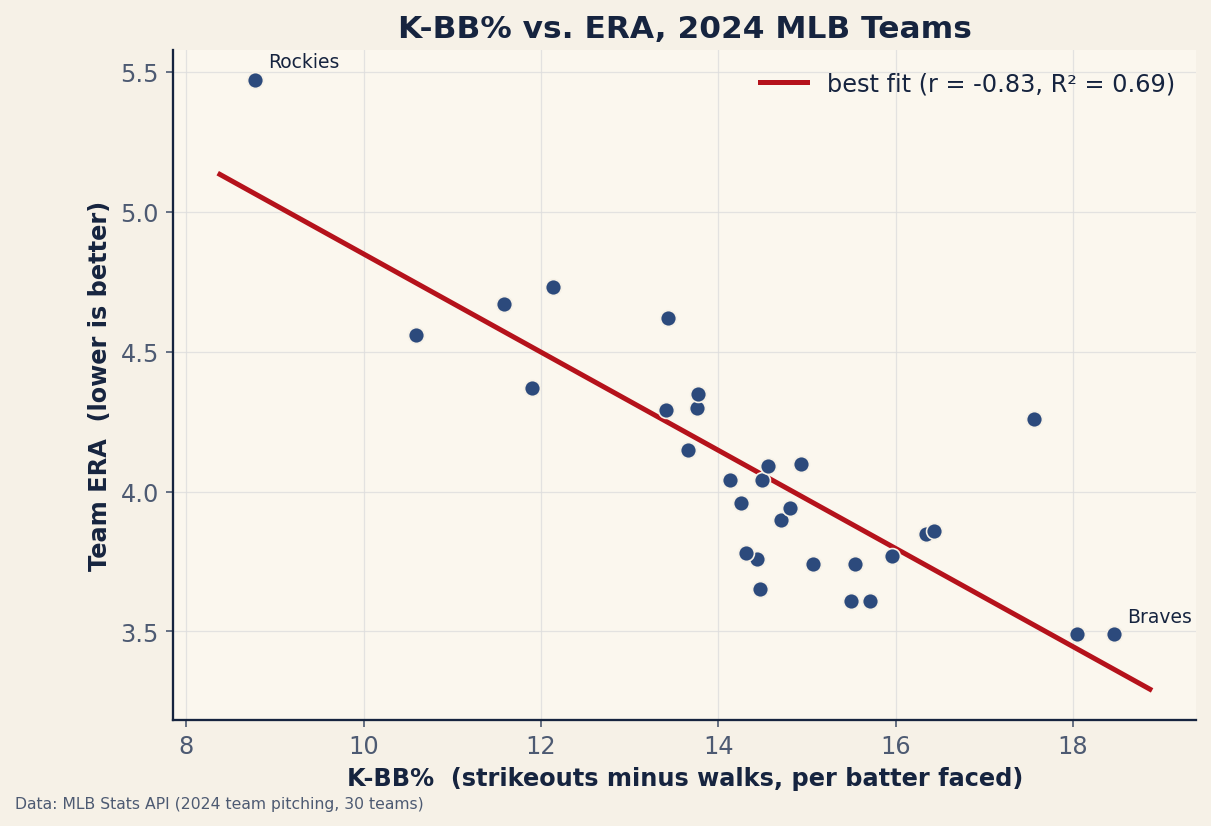
The line is steep and tight. Every one-point gain in K-BB% is worth roughly 0.18 of ERA in this sample, so the gap between the best and worst staffs — about ten points of K-BB% — maps to nearly two full runs of ERA. That a single, defense-independent rate accounts for two-thirds of the variation in run prevention is the whole case for the stat: it's not the most precise pitching number, but it's the most portable one.
A worked example
The Atlanta Braves' staff struck out far more batters than it walked — a K-BB% around 18.5% — and posted a 3.49 ERA, the league's best. The Colorado Rockies sat at the other end: a K-BB% under 9% and an ERA near 5.5. You don't need batted-ball data, park factors, or a defensive model to have seen that coming — the K-BB% gap alone told you one staff was missing bats and throwing strikes while the other was doing neither. That's the point of a stat that travels: it gives you most of the answer before the complicated adjustments even start. For how the more elaborate fielding-independent stats build on this same idea, see FIP and xFIP explained and Stuff+.
Why it travels when ERA doesn't
ERA is an outcome; K-BB% is closer to a skill. Two pitchers with identical strikeout and walk numbers can post very different ERAs because of the defense, the park, and the timing of the hits they allow — and crucially, those differences don't repeat year to year the way strikeouts and walks do. That's why projection systems lean on strikeout and walk rates rather than last year's ERA, and why a pitcher with a great K-BB% but an ugly ERA is the classic “buy-low” target: the skill is real and the bad ERA is partly the stuff that washes out. It's the pitching-side cousin of the lesson that run differential predicts next year better than wins — strip out the luck and what's left carries forward.
Where K-BB% stops
- It ignores contact quality. A pitcher who limits hard contact (think elite groundball or weak-fly-ball arms) can beat his K-BB%; one who gives up loud contact can underperform it. K-BB% says nothing about what happens when the bat hits the ball.
- It's blind to park and defense — by design. That's a feature for measuring skill, but it means a great-defense team can prevent runs better than its K-BB% suggests, and Coors Field will punish a staff worse than the number implies.
- Team-level hides the bullpen/rotation split. A staff K-BB% blends starters and relievers; relievers post higher rates in short bursts, so two staffs with the same number can be built very differently.
- One season, 30 points. The r of −0.83 is strong but it's a single season of team data; the relationship is well-established across years, but exact figures move season to season.
The takeaway
If you can carry only one pitching number into an argument, make it K-BB%. It throws away everything a pitcher doesn't control and keeps the part that does, and that part alone explains most of why some staffs prevent runs and others don't. It won't tell you about contact quality or the park, but it will tell you — quickly, and without a model — who's actually good at the job. The fancier stats are refinements on this foundation, not replacements for it.
Reproduce it
The data is bundled in data_layer/team_pitching_2024.json (2024 team pitching joined to wins, pulled from the MLB Stats API by data_layer/build_team_pitching_2024.py). Compute K-BB% = (K − BB) / BF for each team and correlate with ERA, runs allowed, and win%. The scatter is regenerated by charts/chart_k_bb_pitching.py. No network at build time, nothing hand-entered.
Sources & further reading
- Free textbook: Chapter 22: Correlation and Simple Linear Regression — the theory behind this, at DataField.dev.
- 2024 team pitching and standings: bundled
data_layer/team_pitching_2024.json, pulled from the MLB Stats API (retrieved 2026-06-24), charted bycharts/chart_k_bb_pitching.py. - Related: FIP and xFIP, Stuff+, and the strikeout era.