Picture two identical pitches, two identical ground balls up the middle. Behind one pitcher, the shortstop dives and snuffs the rally; his ERA drops. Behind the other, the same ball skips into center for a single and three more follow it in exactly the wrong order; his ERA balloons. Same pitch, same contact, wildly different number — and that, in one sentence, is the problem with Earned Run Average. It tells you honestly how many runs a pitcher gave up per nine innings, and then it quietly pockets credit (or blame) for plenty the pitcher never controlled.
FIP — Fielding Independent Pitching — was built to peel all of that away. It asks a narrower and, to our mind, fairer question: set aside the fielders and the sequencing luck, and how well did this pitcher do the handful of things that are genuinely his? The mild surprise is that the answer to that question predicts next season better than ERA does.
DIPS: what a pitcher actually controls
The idea underneath FIP is Defense Independent Pitching Statistics — DIPS — and when Voros McCracken floated it around the turn of the century it genuinely sounded like heresy. The claim was that once a ball is put in play, the pitcher has startlingly little say in whether it lands for a hit. Whether a grounder finds the hole or finds the shortstop’s glove comes down to the defense, the positioning, the park, and dumb luck far more than to the man who induced it. People hated this when they first heard it. A lot of them turned out to be wrong.
What a pitcher does control, season to season, are the outcomes that never involve a fielder at all: strikeouts, walks, hit-by-pitches, and home runs. A strikeout is a strikeout in any ballpark with any defense behind it. Those true-outcome events are stable and repeatable; a pitcher’s batting-average-on-balls-in-play is noisy and tends to drift back toward league average. FIP takes that insight and turns it into a single ERA-shaped number.
The FIP formula
FIP is built entirely from those controllable outcomes, each multiplied by its run value, divided by innings pitched, plus a league constant:
Read the coefficients and the pecking order is right there. The home run carries a weight of 13, because it is the worst thing a pitcher can do — a guaranteed run with nobody on, no defense in the world able to save him. A walk or hit-batter runs 3. A strikeout comes in at −2, subtracted because it is unambiguously good and, crucially, takes the fielders out of the equation entirely. And notice what simply isn’t in the formula: no singles, no doubles, no ball in play of any kind. By construction, FIP can’t be rescued by a great defense or sunk by a bad one. That’s the entire point of it.
What the constant does
Left to its own devices, that fraction would land on some weird scale nobody has any feel for. The constant rescues it. Every season it’s set so that league-average FIP equals league-average ERA, which drops FIP onto the ERA scale you already read in your sleep — a 3.20 FIP means exactly what a 3.20 ERA means. We ran this season’s constant straight off the league totals and got 3.135 (the chart rounds it to 3.14), against a league ERA of 4.16. That’s the number quietly doing the calibration behind every FIP on the table below. It isn’t a fudge factor — people get suspicious of it, and they shouldn’t — it’s just the offset that lines the two scales up.
Interactive tool
FIP Calculator
Fielding Independent Pitching from HR, BB, HBP, K and IP — with an editable, league-dependent FIP constant. This interactive calculator needs JavaScript. The formula it uses is printed on this page, so the method works without it.
Reading the 2025 leaders
Here are the 2025 qualified starters, ERA plotted against FIP, with the FIP leaderboard alongside. The diagonal in the figure is the line of agreement; the interesting pitchers are the ones who sit off it.
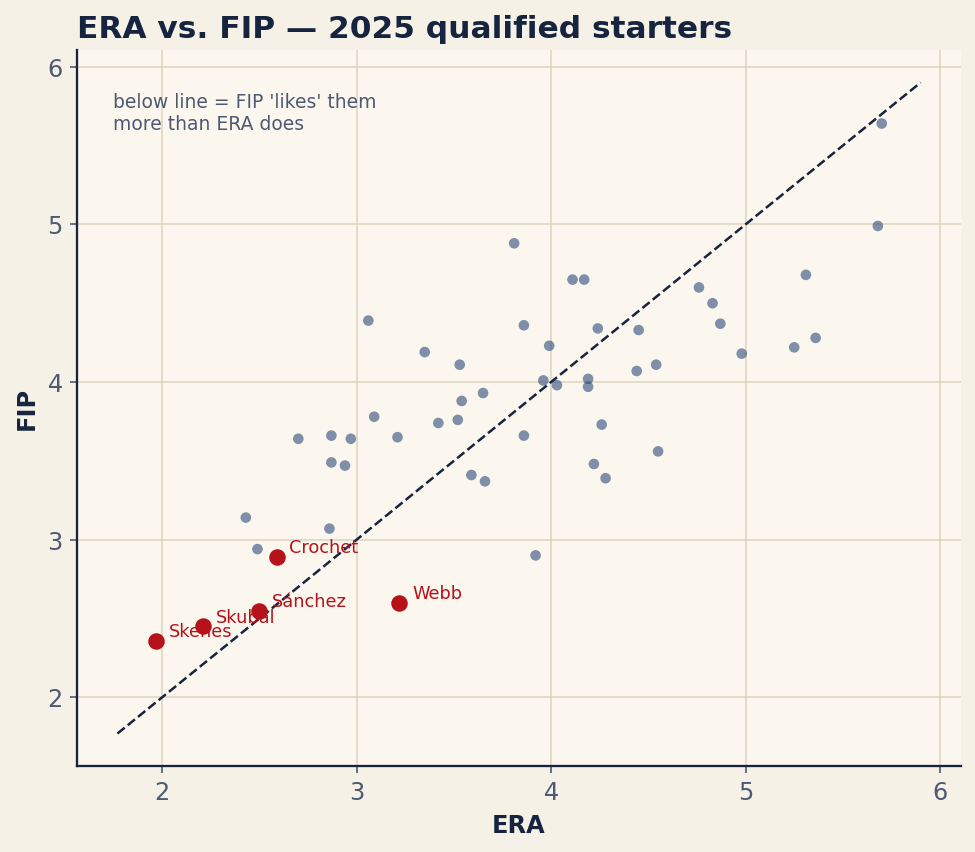
Paul Skenes leads, and he leads convincingly: a 1.97 ERA against a 2.36 FIP. That small gap — an ERA roughly four tenths below his FIP — says his sparkling run prevention was almost entirely earned by missing bats and avoiding walks, with only a modest assist from luck or defense. Tarik Skubal (2.21 ERA, 2.45 FIP) and Cristopher Sánchez (2.50 / 2.55) tell the same story of ERA and FIP nodding in agreement.
| Pitcher | IP | ERA | FIP | ERA−FIP |
|---|---|---|---|---|
| Paul Skenes | 187.7 | 1.97 | 2.36 | -0.39 |
| Tarik Skubal | 195.3 | 2.21 | 2.45 | -0.24 |
| Cristopher Sánchez | 202.0 | 2.50 | 2.55 | -0.05 |
| Logan Webb | 207.0 | 3.22 | 2.60 | 0.62 |
| Garrett Crochet | 205.3 | 2.59 | 2.89 | -0.30 |
| Jesús Luzardo | 183.7 | 3.92 | 2.90 | 1.02 |
| Yoshinobu Yamamoto | 173.7 | 2.49 | 2.94 | -0.45 |
| Max Fried | 195.3 | 2.86 | 3.07 | -0.21 |
| Hunter Brown | 185.3 | 2.43 | 3.14 | -0.71 |
| Framber Valdez | 192.0 | 3.66 | 3.37 | 0.29 |
| Sonny Gray | 180.7 | 4.28 | 3.39 | 0.89 |
| Kevin Gausman | 193.0 | 3.59 | 3.41 | 0.18 |
| Bryan Woo | 186.7 | 2.94 | 3.47 | -0.53 |
| David Peterson | 168.7 | 4.22 | 3.48 | 0.74 |
Now hunt for the disagreements, because that’s where it gets fun. Logan Webb posted a fine 3.22 ERA on top of a sterling 2.60 FIP — his peripherals were quietly better than his runs allowed, an ERA−FIP of +0.62 whispering that better days were coming. Jesús Luzardo is the case that grabs you by the collar: a 3.92 ERA wrapped around a 2.90 FIP, a full run of daylight (+1.02), a pitcher whose results badly lagged his stuff. Sonny Gray (4.28 ERA, 3.39 FIP, +0.89) is the same animal. Pull the other direction and you find Hunter Brown, whose 2.43 ERA outran his 3.14 FIP by seven tenths — a terrific year, no doubt, but one leaning on run prevention his strikeout-and-walk profile doesn’t quite explain.
xFIP: stripping out home-run luck
FIP has one soft spot: it treats every home run as fully the pitcher’s doing, yet the rate at which fly balls clear the fence bounces around year to year and is partly a function of park and chance. A pitcher who surrendered a freak cluster of homers gets dinged for what may be noise.
xFIP — expected FIP — patches exactly that. The formula is identical except for one move: instead of a pitcher’s actual home runs, it plugs in the home runs he would have allowed at a league-average rate per fly ball, given how many fly balls he gave up. If a pitcher allowed an unusually high or low homer rate, xFIP normalizes it. The result is a number that strips out home-run luck and is often the steadier predictor of next season, especially for pitchers with bloated or suppressed homer totals in a small sample.
How to read an ERA−FIP gap — and where it stops
The rightmost column of the table, ERA−FIP, is the one to internalize. A meaningfully positive gap — ERA well above FIP, like Luzardo’s +1.02 — says a pitcher was undone by some mix of poor defense, bad sequencing, or ordinary bad luck, and his run prevention is a candidate to improve. A negative gap — ERA below FIP — flags run prevention that may be running ahead of the underlying skill and could give some back. As a forecasting tool, FIP routinely beats this year’s ERA at predicting next year’s.
But FIP is a model, and we don’t want to oversell it, because it has a real blind spot. By throwing out balls in play, it cannot see the genuine soft-contact artist — the pitcher who truly coaxes weak grounders and lazy cans of corn, start after start, year after year. To FIP, suppressing hard contact just looks like good luck, so it systematically shortchanges the rare arm who actually owns that skill. Which means a stubborn ERA−FIP gap stretched across hundreds of innings isn’t always regression lying in wait; sometimes it’s a real skill that FIP was deliberately built not to measure. This is also why FanGraphs builds its pitching WAR on FIP — it credits the pitcher for what he demonstrably controls — a choice that, by design, will sometimes argue with the run-based numbers.
The bottom line
ERA tells you what happened; FIP tells you how much of it the pitcher earned, and xFIP goes one step further by taming home-run luck. None of the three is the whole story — ERA carries defense and sequencing, FIP can’t see real soft contact — but read together they are far more honest than any one alone. When a pitcher’s ERA and FIP diverge, resist the headline number and look at the gap. Skenes at 1.97 was the genuine article. The pitcher with a 3.90 ERA and a 2.90 FIP might be the better buy.
Sources & Further Reading
- Component totals and computed FIP: MLB Stats API. Numbers retrieved June 2026; the league constant and leaderboard are computed for this article from that source.
- FanGraphs Library — FIP and its xFIP companion, including the current-season constant.
- Baseball-Reference — for ERA and the runs-allowed view that FIP is meant to complement.