Rest or Rust? 134 Postseason Series Say a Layoff Costs Nothing
In 134 postseason series with unequal rest, the more-rested club won 68 against 70.7 its record predicts. Long layoffs and byes show no rust in Game 1 either.
Thursday, October 15, 2026
Baseball analysis from public data, every figure sourced and dated
Est. 2026
Final 2026 regular season: 2,429 games, 8.96 runs a game
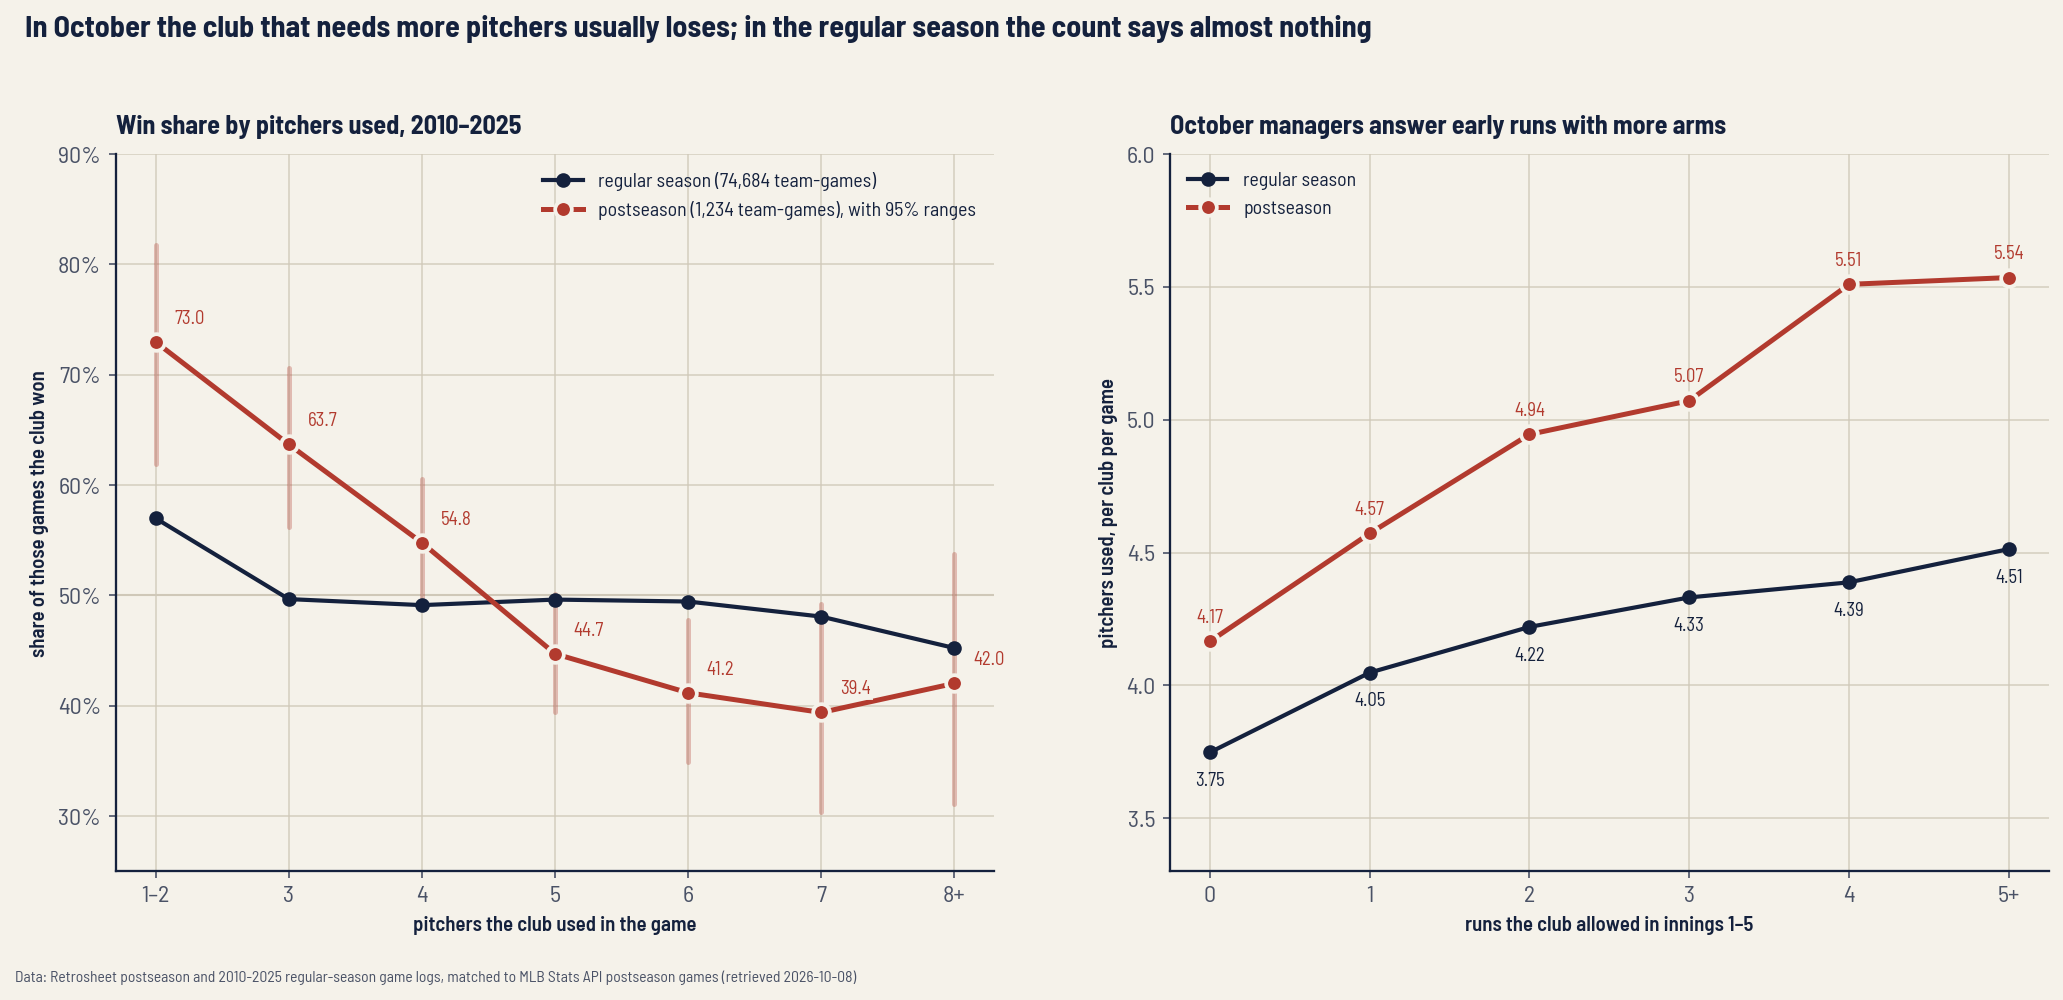
Since 2010 the postseason club that used fewer pitchers won 320 of 482 games, 66.4%, against 52.4% in the regular season. Why the count only matters in October.
In Game 2 of the National League Championship Series on October 12, the Dodgers used eight pitchers and lost 7–4 in Milwaukee. The Brewers used five. Any October box score looks like that now: a line of relievers on each side, and a broadcast graphic counting how many arms each bullpen has left. What the graphic rarely says is that the count itself is one of the better clues to who won.
We counted the pitchers each club used in every postseason game since 1903 and in every regular-season game since 2010. In the regular season the count tells you almost nothing. From 2010 through 2025, when the two clubs used different numbers of pitchers, the one that used fewer won 52.4% of the time. In the postseason over the same years it won 320 of 482 games, or 66.4%. Clubs that got through a postseason game with three pitchers or fewer won 66.5% of the time, and clubs that needed six or more won 40.9%. In the regular season those two groups won 51.7% and 48.7%.
2026 regular season, ended Sep 27
| Club | W | L | Pct | GB | Diff |
|---|---|---|---|---|---|
| AL East | |||||
| x-Rays | 98 | 64 | .605 | — | +86 |
| y-Yankees | 93 | 68 | .578 | 4.5 | +138 |
| y-Red Sox | 87 | 75 | .537 | 11.0 | +78 |
| Orioles | 79 | 82 | .491 | 18.5 | −21 |
| Blue Jays | 79 | 83 | .488 | 19.0 | −46 |
| AL Central | |||||
| x-Guardians | 85 | 77 | .525 | — | +11 |
| y-White Sox | 84 | 78 | .519 | 1.0 | +56 |
| Twins | 77 | 85 | .475 | 8.0 | −58 |
| Tigers | 76 | 86 | .469 | 9.0 | +71 |
| Royals | 69 | 93 | .426 | 16.0 | −120 |
| AL West | |||||
| x-Astros | 81 | 81 | .500 | — | −32 |
| Rangers | 80 | 82 | .494 | 1.0 | −46 |
| Mariners | 76 | 86 | .469 | 5.0 | −58 |
| Athletics | 64 | 98 | .395 | 17.0 | −238 |
| Angels | 62 | 100 | .383 | 19.0 | −97 |
| NL East | |||||
| x-Braves | 94 | 68 | .580 | — | +116 |
| y-Phillies | 88 | 74 | .543 | 6.0 | +15 |
| Marlins | 80 | 82 | .494 | 14.0 | +3 |
| Nationals | 77 | 85 | .475 | 17.0 | +6 |
| Mets | 74 | 88 | .457 | 20.0 | −32 |
| NL Central | |||||
| x-Brewers | 103 | 59 | .636 | — | +214 |
| y-Cubs | 89 | 73 | .549 | 14.0 | +147 |
| Pirates | 82 | 80 | .506 | 21.0 | +28 |
| Cardinals | 77 | 85 | .475 | 26.0 | −29 |
| Reds | 75 | 87 | .463 | 28.0 | −160 |
| NL West | |||||
| x-Dodgers | 100 | 62 | .617 | — | +201 |
| y-Padres | 91 | 71 | .562 | 9.0 | +41 |
| D-backs | 86 | 76 | .531 | 14.0 | +9 |
| Giants | 65 | 97 | .401 | 35.0 | −91 |
| Rockies | 58 | 104 | .358 | 42.0 | −192 |
2026 final, all 30 clubs
| 1 | Brewers | +214 |
|---|---|---|
| 2 | Dodgers | +201 |
| 3 | Cubs | +147 |
| 4 | Yankees | +138 |
| 5 | Braves | +116 |
| 1 | Reds | +9.8 |
|---|---|---|
| 2 | Rays | +7.8 |
| 3 | Padres | +5.7 |
| 4 | Phillies | +5.4 |
| 5 | Athletics | +4.2 |
| 1 | Tigers | −12.6 |
|---|---|---|
| 2 | Angels | −8.8 |
| 3 | Giants | −6.6 |
| 4 | Rockies | −6.4 |
| 5 | Cubs | −5.9 |
Expected wins from runs scored and allowed, Pythagorean exponent 1.83.
| 2023 | 9.23 |
|---|---|
| 2024 | 8.79 |
| 2025 | 8.89 |
| 2026 | 8.96 |
Best offense: Cubs, 5.25 runs a game. Fewest: Blue Jays, 4.00. The 1.25 gap is the narrowest of any full season since 2010.
All figures from The 2026 MLB Regular Season, By the Numbers.
In 134 postseason series with unequal rest, the more-rested club won 68 against 70.7 its record predicts. Long layoffs and byes show no rust in Game 1 either.
Up 1-0, up 2-0, up 3-1: 381 postseason series since 1903 say a lead is worth about what a coin flip predicts. Momentum doesn't show up in the data; home field does.
Since the runner on second arrived, 71.4% of extra-inning games end in the 10th, up from 44.8%, and home teams gained nothing. The postseason drops the rule.
No division winner has ever finished below .500, and the fewest wins any managed is 82. The 2026 AL West champion lands under that 52.4% of the time.
Articles in each section
Each prints the formula it uses, by what it measures