Originally published July 9; numbers and chart updated through the games of August 15, 2026. When this piece first ran, the Dodgers were outscoring their opponents by 164 runs through 94 games — +1.75 per game, a pace that only one of the 120 finished team-seasons since 2021 (the 2022 Dodgers) had ever ended a year above. Five weeks later, the honest update is that the pace did what paces do. The Dodgers now sit at +140 through 124 games — +1.13 per game — and eleven of those 120 finished seasons ended higher. The wall never moved; the chase did. This piece keeps the same ruler and re-measures everything against it, because the ruler was always the point.
This piece does three things with two bundled datasets: puts 2026’s extremes — top and bottom — against every full-season finish since 2021, checks whether the league’s middle really is as crowded as it feels, and owns the methodological catch that the July version flagged and August then demonstrated (a mid-season pace is not a 162-game achievement).
The ceiling: from historic to merely excellent
Per game is the honest unit — it puts a 124-game season-in-progress and a 162-game finished season on the same axis without pretending they’re the same thing. On that axis, the 2026 Dodgers sit at +1.13 runs per game. In July that number was +1.75 and the list of better full-season finishes had one name on it. Since then Los Angeles has been outscored — by 24 runs across its last 30 games — and the list above the pace has grown to eleven: both recent Dodger peaks (2022’s +2.06, 2021’s +1.66), the 2022 Yankees and Astros, the 2023 Braves, and a tier of +1.1-to-+1.3 finishes from the 2021–2023 contenders. A +1.13 pace is still comfortably a top-ten-percent season by the standards of this window — it extrapolates to +183 over 162 games — but “chasing the 2022 wall” is over. That is the material change since July, and pretending otherwise would defeat the purpose of owning a ruler.
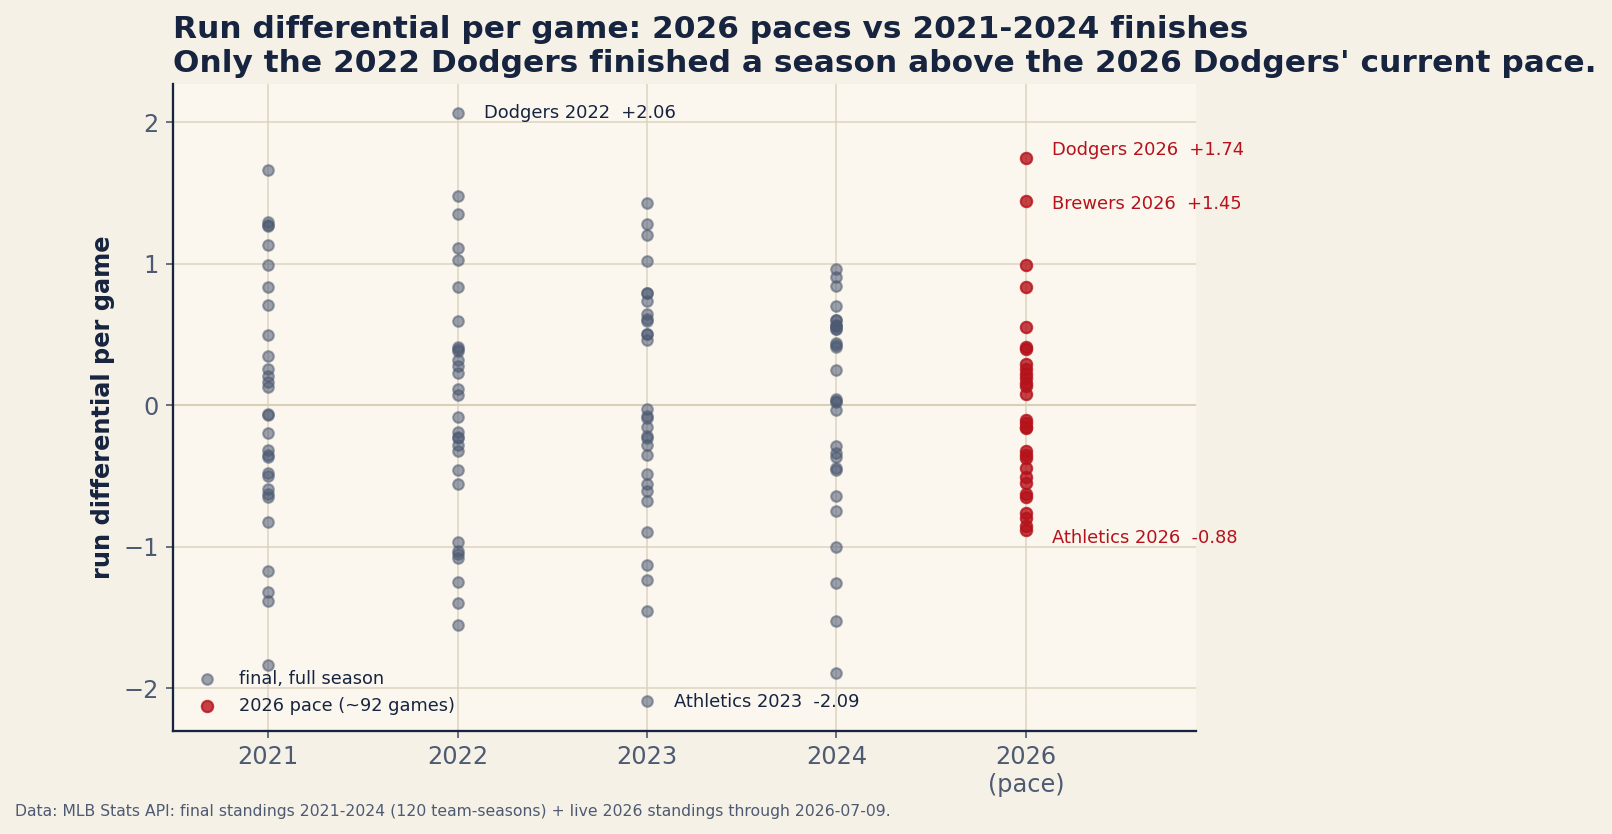
The Brewers tell the same story one notch down. Milwaukee — at 76–48 now the owner of baseball’s best record — sits at +1.06 per game (+132 in 124), down from +1.45 in mid-July, with twelve finished seasons above that pace. Two teams above +1.0 per game in mid-August is still a strong top of the league; it is no longer something the 2021–2024 finish lines never produced. And the Dodgers no longer even lead the standings they used to headline: they hold the best run differential (+140 to Milwaukee’s +132) while trailing the Brewers by two games in the win column — the sort of gap between differential and record that this site’s Pythagorean ledger exists to track.
| Team | RD/game | Raw | Status |
|---|---|---|---|
| Dodgers 2022 | +2.06 | +334 / 162 g | finished — the wall |
| Dodgers 2026 (July 9 pace) | +1.75 | +164 / 94 g | did not hold |
| Dodgers 2021 | +1.66 | +269 / 162 g | finished |
| Yankees 2022 | +1.48 | +240 / 162 g | finished |
| Braves 2023 | +1.43 | +231 / 162 g | finished |
| Astros 2022 | +1.35 | +219 / 162 g | finished |
| Dodgers 2026 | +1.13 | +140 / 124 g | pace (+183 over 162); 11 finishes above |
| Brewers 2026 | +1.06 | +132 / 124 g | pace (+172 over 162); 12 finishes above |
The floor flipped: now it’s the bottom that’s historic
The July version’s second finding was that the floor was boring — the worst differential in baseball was the Athletics’ −0.88 per game, a figure twenty historical seasons had finished below. That finding has not survived either, and it failed in the opposite direction. The Athletics have collapsed to −1.44 per game (−177 in 123, a 48–75 record), and only six of the 120 finished seasons since 2021 ended worse: the 2023 and 2024 Rockies, the 2022 Nationals, the 2021 Orioles, the 2024 White Sox, and the −339 catastrophe of the 2023 Athletics. Over 162 games the current pace works out to −233. So the season now has the shape July lacked — a genuinely historic tail — it’s just at the bottom of the chart instead of the top. The next-worst team, the Rockies at −0.97 (−119 in 123), is the kind of ordinary-bad the whole floor looked like five weeks ago.
The middle, meanwhile, has held its shape. Eleven of thirty 2026 teams sit inside ±0.30 runs per game — the band where run differential says “basically even team” — exactly the count from July. No season since 2021 finished with a middle that fat: 2022 came closest with nine of thirty, 2024 had just six. The same honest wrinkle applies as before: differentials compound as games accumulate, so a mid-August middle and a December middle aren’t the same object. Read it as “the 2026 middle is still crowded right now,” not as a finished-parity record — though holding the count at eleven through five more weeks of games makes the crowding claim stronger than it was in July.
The catch, vindicated: paces regress
The July version of this piece ended its analysis with a warning: the +283-over-162 extrapolation was “arithmetic, not a forecast,” mid-season extremes are partly variance that hasn’t washed out, and whether the Dodgers and Brewers could stay above +1.4 through September was the actual open question. The answer arrived early: neither made it to mid-August. The Dodgers shed six tenths of a run per game of differential in five weeks; the Brewers shed four tenths while climbing to baseball’s best record. That is regression doing exactly what the textbook says it does — and it’s worth being precise that this is the boring kind of vindication, not a collapse: +1.13 and +1.06 would both rank among the dozen best finishes of the last four completed seasons. The 2022 Dodgers’ +2.06 remains what it was in July: the wall, four years standing, and further away than ever this year.
For what run differential is worth in wins — and who beat their differential in the standings — the 2026 season page carries the full-season Pythagorean ledger; the scoring backdrop that inflates or deflates all these raw numbers is in the 2026 run environment piece.
Reproduce it
Both datasets are bundled and re-buildable. data_layer/build_standings_multiseason.py pulls final regular-season standings 2021–2024 from statsapi.mlb.com into standings_multiseason.json (W, L, RS, RA per team-season; 2020 omitted as a 60-game season); data_layer/refresh_mlb_2026.py pulls the live 2026 standings into mlb_2026_standings.json; because that file is overwritten on every refresh, this update cites the frozen, dated copy mlb_2026_standings_2026-08-16.json (the 2026-08-16 pull, standings through the games of August 15), served alongside it. Run differential per game is (RS − RA) / games; the ±0.30 middle is a straight count. The chart is charts/chart_run_diff_context.py; re-running the refresh and the chart any morning re-measures the season against the same 120-season ruler, which is how this update was produced.
Sources & Further Reading
- Final standings 2021–2024 and live 2026 standings: MLB Stats API, bundled as
data_layer/standings_multiseason.jsonanddata_layer/mlb_2026_standings_2026-08-16.json— a frozen, dated copy of the live standings file, served so these figures stay checkable after the next refresh (the 2026-08-16 pull; 2026 standings through the games of 2026-08-15). - Tango, Lichtman & Dolphin, The Book: Playing the Percentages in Baseball — runs-to-wins conversion and the limits of differential as a talent proxy.