This is a living, data-only snapshot of the 2026 MLB season, refreshed straight from the MLB Stats API as games are played. We're about halfway through the 162-game season — teams have played about 82 games each — so the standings have stopped being noise and started being signal, without being settled. Here is what the real numbers say through June 27: who is genuinely good, who the run differential says is a mirage, and where the division races stand. Nothing here is projected or invented — every figure is a real result.
The standings, with a truth serum
Win-loss records are what everyone watches, but run differential — runs scored minus runs allowed — is the better measure of how good a team actually is, because it doesn't care about the lucky timing of a few one-run games. So far the Dodgers own the best mark in baseball at +138, which lines up with their 52-30 record. At the other end, the Rockies sit at -91, the worst in the majors. The league as a whole is scoring 8.98 runs a game between the two teams.
The exhibit: who's outrunning their run differential
The Pythagorean formula turns run differential into an expected win total — expected win% = RS1.83 / (RS1.83 + RA1.83). The gap between a team's actual wins and that expectation is essentially luck: the sequencing of runs and a team's record in close games, neither of which carries forward. Here is every team's wins above or below their Pythagorean expectation this season.
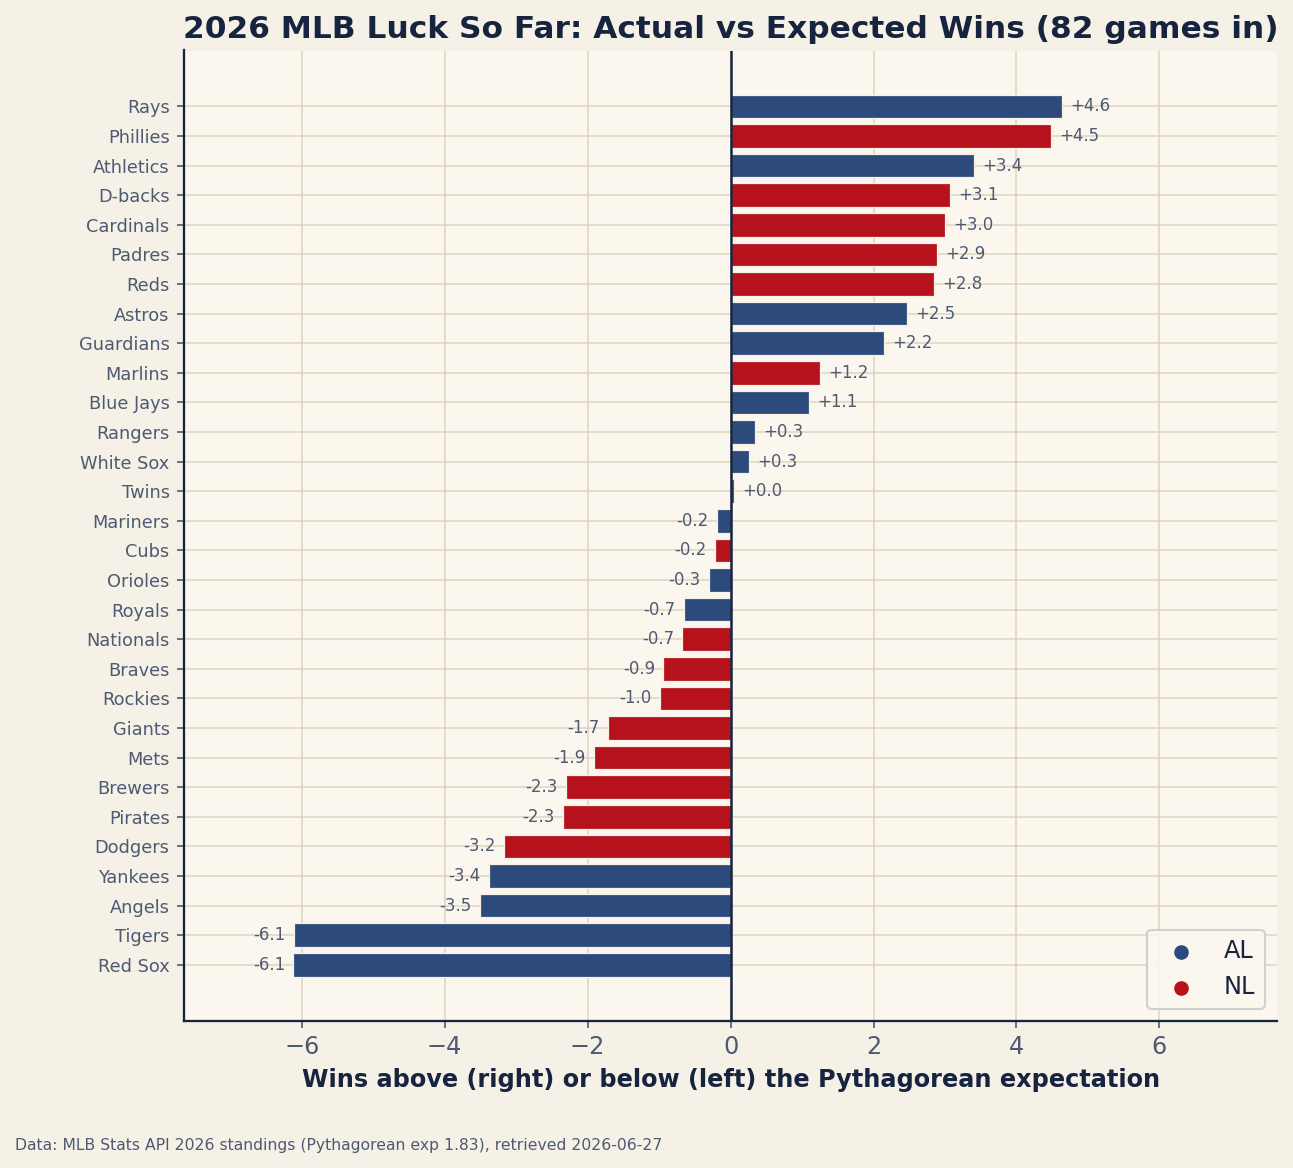
The Rays are the season's biggest overachievers, at roughly 46 wins against a Pythagorean expectation of 41.4 — about 4.6 wins of good fortune that history says tends to evaporate. The Red Sox are the opposite story: 34 wins where their run differential suggests 40.1, a team playing better than its record. If you want one number to bet on for the second half, the expectation is usually a better guide than the record — the same logic behind why run differential predicts next year better than wins.
The division races
Six teams currently lead their divisions:
- Dodgers — NL West (52–30)
- Brewers — NL Central (50–29)
- Braves — NL East (49–31)
- Yankees — AL East (48–33)
- White Sox — AL Central (42–38)
- Mariners — AL West (42–41)
Division leads this far in are meaningful but not decided — a five-game cushion can vanish over a bad fortnight, and the second-half schedule matters. The teams with the run differential to back up their record are the safer bets to still be there in September.
The honest caveats
- It's half a season. About 82 games is enough to separate good from bad, but not enough to be final — injuries, trades at the deadline, and plain regression will reshuffle this. Treat every figure as “as of June 27.”
- Run differential isn't destiny. It's the best simple measure of quality, but it can be inflated by a few blowouts; a team that wins a lot of blowouts and loses close games looks better by run differential than its record.
- “Luck” is shorthand. The gap from Pythagorean expectation is mostly one-run-game timing, but some of it is real — a great bullpen genuinely wins more close games. The label is a prior to regress toward, not a verdict.
- One source, live data. Everything comes from the MLB Stats API, refreshed each build. Numbers move daily; this snapshot is only as current as its retrieval date.
The takeaway
82 games into 2026, the Dodgers are the best team in baseball by the measure that matters most, the Rays are the biggest overachievers due for some regression, and the Red Sox are better than their record. Check back as the season turns — this page refreshes from the live standings, so the numbers and the chart move with the games.
Reproduce it
The standings are pulled from the MLB Stats API into data_layer/mlb_2026_standings.json by data_layer/build_mlb_2026.py; the luck chart is drawn by charts/chart_mlb_2026_luck.py, and this page is re-rendered from the live data by data_layer/refresh_mlb_2026.py each build — so the prose, the statline, and the chart can never drift apart. Pythagorean expected wins use exponent 1.83.
Sources & further reading
- Free textbook: Chapter 22: Correlation and Simple Linear Regression — the theory behind run differential and wins, at DataField.dev.
- Live standings: bundled
data_layer/mlb_2026_standings.json, pulled from the MLB Stats API, charted bycharts/chart_mlb_2026_luck.py. - Related: run differential predicts next year better than wins, how many runs a win costs, and what Pythagorean exponent fits best.