Here is the punchline first: a win costs about 10.7 runs. I took 60 team-seasons — all 30 clubs in 2023 and all 30 in 2024 — and regressed regular-season wins on run differential. The slope came back at 0.0934 wins per run, and flipping that over gives one win for every 10.7 runs of differential. The old back-of-the-envelope rule that “ten runs buys a win” is not folklore. It is almost exactly right, just a hair on the high side. If you only remember one number about how baseball converts runs into standings, make it this one.
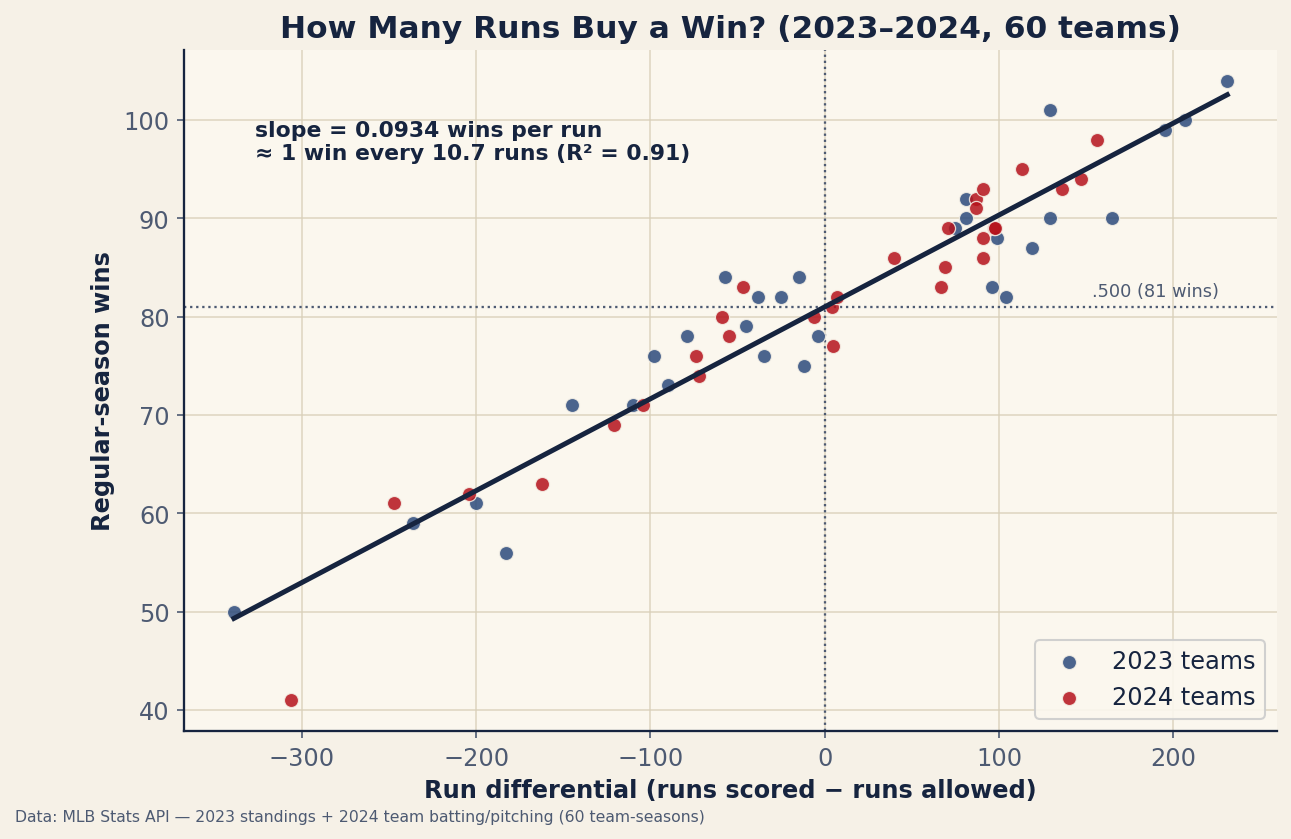
Look at that scatter and the thing that should jump out is how little the points wander off the line. The fit explains 91 percent of the variation in wins (R² = 0.907). That is an unusually clean relationship for anything in sports, where noise usually drowns the signal. Run differential is not one input among many into the standings — it is very nearly the whole story.
The intercept is the tell
The regression line is wins ≈ 80.98 + 0.0934 × (run differential). Round the intercept and you get 81. A team that scores exactly as many runs as it allows — a run differential of zero — is predicted to finish 81–81, a perfect .500 over a 162-game season. I did not force that. The math found it on its own from the data, and that is the single best sanity check I know of that the model is built correctly. If break-even runs had predicted 76 wins or 86 wins, I would have gone looking for a bug. Instead it landed on the one number the structure of a balanced schedule demands.
Working the extremes
A model that fits the middle of the pack but falls apart at the edges is not worth much, so let me push it to both ends with real teams.
The 2023 Atlanta Braves were a wrecking crew, outscoring opponents by +231 runs. Plug that in: 81 + 0.0934 × 231 = 102.6 wins. They actually won 104. The 2023 Oakland A’s were the photographic negative of that team, bleeding −339 runs. The model says 81 + 0.0934 × (−339) = 49.3 wins. They won 50. One club 30 games over the break-even point, the other nearly 30 under it, and the same little equation lands within a win or two of both. That is the part that convinces me. A rule that only works for 81-win teams is a tautology; this one survives a 54-game spread in true talent.
What this buys a general manager
The reason front offices care about runs-per-win is that it is the exchange rate between player value and standings. Player projections come out in runs — runs created on offense, runs saved on defense and the mound. Wins are what actually decide jobs and playoff spots. The 10.7 figure is the conversion.
So if your analytics group hands you a free-agent bat projected to be worth +20 runs over a replacement-level filler, that player is worth roughly 20 / 10.7 ≈ 1.9 wins. Call it two wins. Now you can reason about money: if the going rate is several million dollars per win, you know within a rounding error what that bat should command and whether the asking price is sane. The same arithmetic runs in reverse for a trade — surrender a reliever worth +11 runs and you have handed the other team about one win. Runs are the currency players are priced in; this is the line that converts them into the only thing the standings record.
Where the number bends — and where it breaks
Now the honest part, because I would be selling you something if I pretended 10.7 is a constant of nature. It is not. The runs-per-win value scales with the run environment. In a high-offense era, when teams are stacking up five-plus runs a game, a single run is a smaller share of a typical game’s scoring, so it takes more runs to flip a win — the divisor climbs above ten. In a pitching-choked, three-runs-a-game world, every run matters more and a win costs fewer runs. The 10.7 I measured belongs to 2023–24, two seasons that ran around 4.5 runs per game. Drop this rule into the 1968 “Year of the Pitcher” or the late-90s slugfests and the slope would move.
There is a second wrinkle. The true relationship between runs and wins is the curved Pythagorean one, not a straight line. My regression fits a line through it, which works beautifully across the range real teams actually occupy but is a local approximation. At the absurd extremes — a team outscoring opponents by 500 runs — the curve flattens, because you cannot win more than 162 games no matter how many runs you pile on, and the linear version would happily predict 127 wins. Stay inside the cloud of real teams and the line is excellent; extrapolate past it and it lies.
Finally, individual seasons carry sequencing and cluster luck. Two teams with identical run differentials can finish several games apart purely on the timing of their runs — whether they bunched offense into blowouts or spread it across close games. That is exactly why the dots scatter off the line at all, and it is the same phenomenon behind the luckiest and unluckiest teams and behind regression to the mean: a club that beats its run differential one year tends to drift back toward it the next. If you want the forward-looking version of this, run differential is also a better bet on next season than this season’s win total — I went through that in does run differential predict next year.
Where the rule comes from
None of this is mine. The linear-weights framework that treats a win as a fixed number of runs traces to Pete Palmer and John Thorn in The Hidden Game of Baseball, which set the original “about ten runs per win” benchmark decades ago. The refinement — that the value is not fixed but a function of the run environment — is Tom Tango’s territory, the same logic that drives Pythagenpat, where the Pythagorean exponent itself flexes with how many runs are being scored. My contribution here is small: I confirmed, on two recent seasons of primary data, that the rule still lands almost exactly where Palmer and Thorn put it.
Reproduce it yourself
The whole thing is one equation: wins ≈ 81 + 0.0934 × (run differential). It is recomputed by charts/chart_runs_per_win.py, which pulls 2023 run differential straight from data_layer/standings_2023.csv and reconstructs 2024 differential by joining team runs scored in team_batting_2024.json to team runs allowed in team_pitching_2024.json, then fits the line across all 60 team-seasons. Every number in this piece — the 0.0934 slope, the 0.907 fit, the 80.98 intercept — falls out of that script. If you would rather feel the curve than read about it, drop run differentials into the Pythagorean tool on the calculators page and watch how the runs-per-win cost shifts as you change the scoring level.
Sources & further reading
- Free textbook: Chapter 22: Correlation and Simple Linear Regression — the theory behind this, at DataField.dev.
- Primary data: MLB Stats API, bundled here as
data_layer/standings_2023.csvplusteam_batting_2024.jsonjoined toteam_pitching_2024.json, with the regression run bycharts/chart_runs_per_win.py. - Origins: Pete Palmer & John Thorn, The Hidden Game of Baseball — the source of the linear-weights, ~10-runs-per-win framework — and Tom Tango’s Pythagenpat work on runs-per-win as a function of the run environment.
- Related: What Pythagorean exponent fits best, run differential as a predictor of next year, and regression to the mean explained.