Check the batting-average leaderboard in late April and you’ll find names you did not expect, a few of them flirting with .400, and somewhere a column declaring that one of them has finally “turned a corner.” A few have. Most are about to cool off. The reason is one of the most reliable forces in all of statistics — regression to the mean, the gravity that pulls extreme early results back toward what a player can actually do.
It is also the single most misunderstood idea in baseball analysis, routinely confused with a superstition that says the exact opposite. Getting it right is the difference between reading a hot start as a signal and reading it as noise — and between buying a breakout and getting burned by a mirage.
What it actually is
Regression to the mean rests on a simple decomposition: any observed performance is part true talent and part luck. A hitter’s .400 average through three weeks is not purely skill and not purely fortune — it is some blend of the hitter he really is and the bounces that happened to go his way in a small sample. The luck component, by definition, does not persist. The skill component does. So as the sample grows, the lucky portion washes out and performance drifts back toward true talent.
There is a second, subtler layer. True talent itself tends to sit closer to the population mean than an extreme observation does, because extreme observations are precisely the ones most inflated by luck. The hitter leading the league in April is more likely to be a genuinely-good hitter having a lucky month than a genuinely-historic hitter performing exactly to talent. So the drift is toward true talent, and true talent is usually nearer the crowd than the early number suggested. The further from average a small-sample result sits, the more of it you should expect to give back.
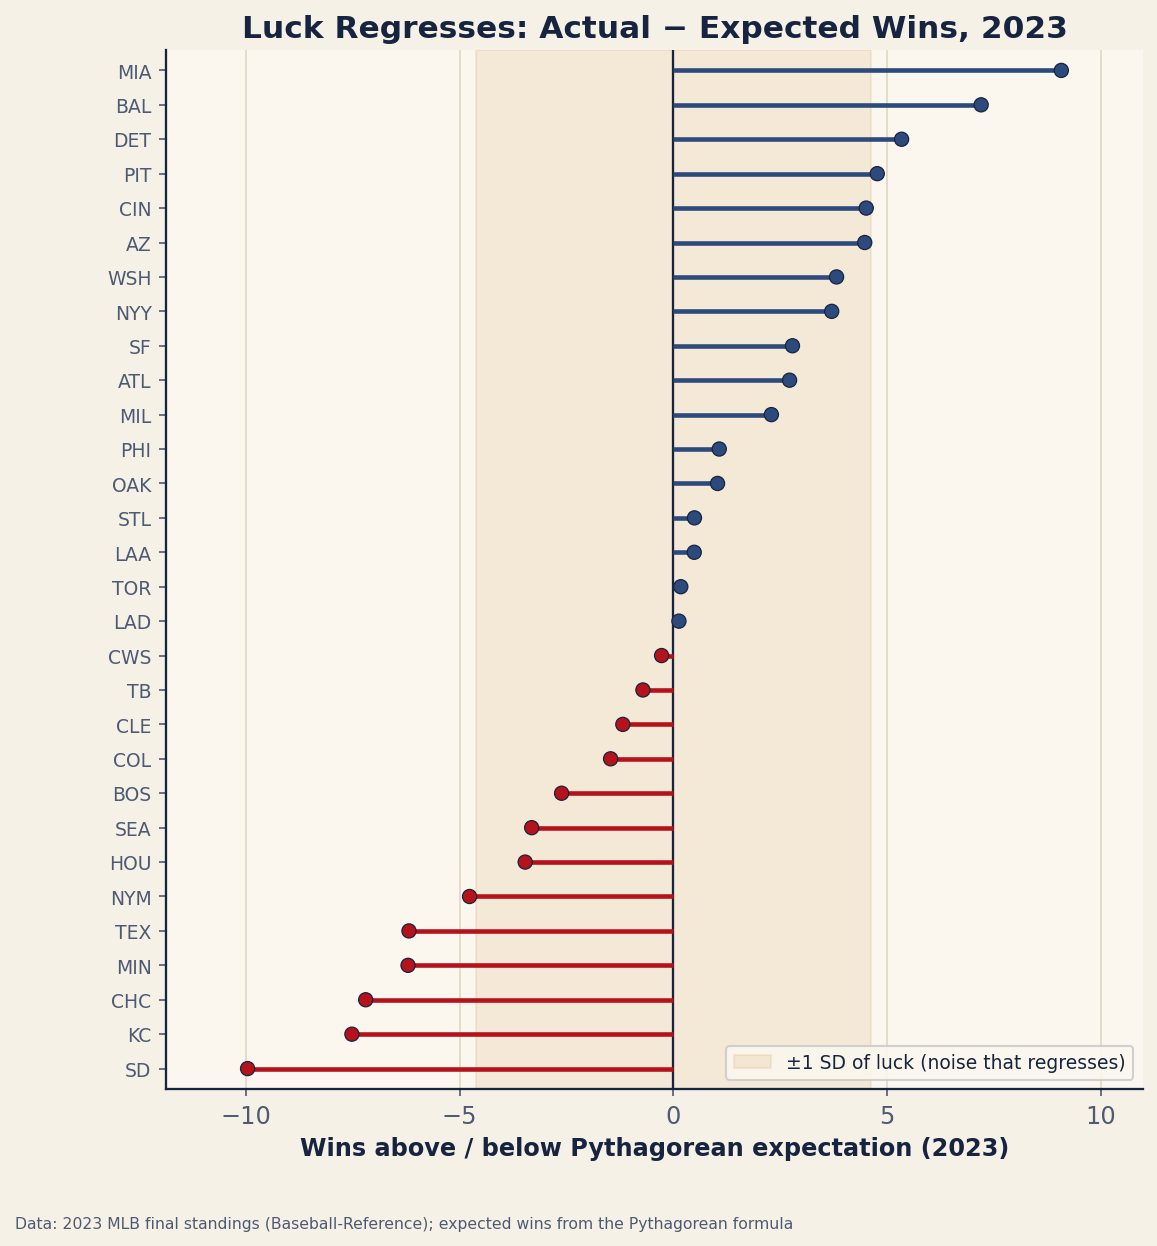
The cleanest team-level picture of the lucky component is the gap between a club’s actual wins and the wins its run differential earned it through the Pythagorean formula. That residual is almost pure timing luck — how the runs happened to clump into wins — and it is exactly the kind of quantity that does not persist. The chart below shows it for all thirty teams in a real season: most cluster inside a narrow band of everyday noise, and the handful at the extremes are the ones whose records most overstated, or understated, how good they actually were.
What it is not
Here is where most people go wrong. Regression to the mean is not the gambler’s fallacy. It does not say a slumping hitter is “due” for hits because he has made too many outs, any more than a fair coin that has come up heads five times is “due” for tails. The ball has no memory; the next at-bat does not know what the last ten did.
The distinction is exact. The gambler’s fallacy expects past results to be balanced out by future results in the opposite direction. Regression to the mean expects future results to be generated by true talent, unaffected by the past, so the long-run average settles near talent simply because that is what keeps producing the outcomes. A .220 hitter who started 2-for-30 is not owed a 12-for-20 stretch to compensate — he is just likely to hit like a .220 hitter going forward, which on its own pulls his season line up toward .220. Regression is a statement about where performance is heading, never about a cosmic debt being repaid.
A worked example
Make it concrete with a clearly hypothetical case. Suppose a hitter is riding a .400 BABIP — batting average on balls in play — through the end of April, while the league as a whole sits somewhere around .290 to .300, where it reliably clusters. His overall average looks spectacular, and the highlight reel is full of seeing-eye singles and bloops that found grass.
Regression to the mean says: unless this hitter has the contact quality to earn a sky-high BABIP — elite exit velocity, a line-drive-heavy profile, real speed — that .400 is mostly the lucky half of the decomposition, and it will drift down toward his own established norm, which itself sits near the league’s .290–.300 gravity. The forecast is not “he will go ice cold to balance it out” (that would be the fallacy). The forecast is “his future balls in play will fall for hits at roughly his true rate, and since that rate is lower than .400, his season number will sag toward it.” Same data, completely different mental model — and only one of them is correct. (Numbers here are illustrative, chosen to show the mechanism.)
Which stats stabilize fast, which slow
Not every statistic regresses at the same speed, and knowing the order is half the battle. A well-known body of sabermetric research has measured how many plate appearances different stats need before the signal outweighs the noise — the point at which a number starts telling you more about the player than about luck. The findings are consistent and worth carrying around as a rough hierarchy.
Strikeout rate stabilizes quickly — it becomes meaningful in a relatively small number of plate appearances, because it depends heavily on the hitter’s own approach and contact ability. Walk rate stabilizes a bit more slowly, but still fairly early. At the other end, batting average and BABIP take a very large sample — a substantial chunk of a full season or more — before they shake off the luck, which is precisely why a April batting average is nearly worthless as a talent estimate while an April strikeout rate already means something. I am citing this as well-established research rather than quoting exact thresholds, because the published numbers vary by method and I would rather you trust the ranking than a memorized figure. The takeaway is the ordering: contact and plate-discipline rates firm up fast; outcome-on-contact rates firm up slowly.
How projection systems use it
Regression to the mean is not just a way of thinking — it is literally how projection systems are built. A simple, transparent approach in the Marcel mold takes a player’s recent performance and deliberately regresses it by mixing in a chunk of league-average performance, as though the player had logged a number of additional plate appearances at exactly the league rate. A hitter with a small, extreme sample gets pulled hard toward average; a hitter with a large, stable sample barely moves, because there is little luck left to remove.
That single mechanism — add a dose of the mean, weighted by how little real evidence you have — is regression to the mean operationalized. More sophisticated systems do fancier versions of the same move, but the spine is identical: never trust a small sample at face value, always shrink it toward the population, and shrink it harder the smaller and more extreme it is.
Putting it to use
For the everyday fan and the fantasy manager alike, regression to the mean is the engine behind buy-low and sell-high. The hitter whose surface line has run far ahead of his underlying skill is a sell-high candidate — bank the inflated numbers before they correct. The hitter buried by bad luck, whose batted-ball quality says he deserves better, is a buy-low. The trick is distinguishing the lucky from the legitimately good, and that is exactly where expected stats earn their keep.
Expected metrics like xwOBA are a regression signal you can read directly. When a hitter’s actual numbers are soaring but his expected numbers lag behind, regression has a target and a direction: down, toward what the contact deserved. When the expected numbers are climbing right alongside the real ones, the hot start may be the genuine article and regression has little to pull on. Use the expected stat to decide whether the early number is a check the schedule will cash — or a skill that is going to stick.
The bottom line
Regression to the mean is the quiet correction that turns April mirages back into June reality: extreme early results are part luck, the luck does not last, and performance drifts toward true talent, which lives near the league mean. It is not the gambler’s fallacy — nobody is “due” for anything; the future is simply generated by talent, not by a debt owed to the past. Strikeout and walk rates firm up fast, batting average and BABIP take ages, projection systems regress by adding a slug of league average, and expected stats tell you which direction the correction runs. Internalize it and you stop being fooled by small samples — which is most of what separates a sharp read from a hot take.
Sources & Further Reading
- For the fundamentals, see Chapter 22: Correlation and Simple Linear Regression in DataField.dev’s free textbook library.
- FanGraphs Library — explainers on sample size, stat stabilization, and regression.
- FanGraphs — projections and expected-stat leaderboards for spotting regression candidates.
- Baseball Savant — Statcast expected metrics (xwOBA, xBA) used as regression signals.