ZiPS, Steamer, and PECOTA drop their projections every winter, and every winter the same complaint follows. A fan pulls up his favorite player’s line, sees a number lower than last season’s career year, and concludes the computer has a grudge. It doesn’t. It is doing something far more boring and far more useful: regressing a great season toward the great middle of everything, because that is what great seasons tend to do next.
The cleanest way to understand any of those systems is to build the dumbest one first. That system has a name — Marcel, after Marcel the Monkey from the old sitcom Friends, because its inventor Tom Tango wanted to stress that a monkey could run it. Marcel is deliberately, almost insultingly simple, and it is still hard to beat by much. If you understand Marcel, you understand the bones of the whole field.
Three ingredients and nothing else
Marcel forecasts a player’s next season from three ideas, and only three. First, recent seasons matter more than old ones, so it weights the last three years on a 5/4/3 scale — the most recent season counts five parts, the year before four, the year before that three. Second, small samples lie, so it pulls every projection partway back toward league average, and it pulls harder when there is less playing time to trust. Third, players age, so it applies a small adjustment up for the young and down for the old.
That is the entire philosophy. No park factors, no scouting reports, no minor-league translations, no fielding. The version I built for this article, in marcel_projection.py, projects a single stat — OPS — from real 2023–2025 MLB data, so we can watch the machinery work on names you know rather than on a column of anonymous run values.
Step one: a recency-weighted average
The first move is to collapse three seasons into one number, giving recent performance more say and giving full-time players more say than part-timers. Marcel does both at once by weighting each season by its plate appearances and by the 5/4/3 recency factor. In code that is one line; written out, it is this:
Take Aaron Judge. His OPS over the three seasons was 1.019, then 1.159, then 1.145 — a monstrous run with the heaviest weight landing on the two enormous recent years. The weighted average of those lands well above 1.1. Shohei Ohtani, by contrast, posted 1.066, 1.036, and 1.014: a gentle three-year slide, so his weighted figure sits a touch below where his middle season was. Already the method is doing something sensible — it is summarizing a career arc, not just echoing the last data point.
Step two: regress toward the league
A weighted average of a star’s three best seasons would, on its own, predict another season just as good. History says that is too optimistic. Extreme performances are part skill and part luck, and luck does not re-sign for next year. So Marcel computes a reliability — a number between zero and one that asks “how much of this should I believe?” — and uses it to blend the player’s weighted OPS with the league’s.
projection = weighted_OPS × reliability + lgOPS × ( 1 − reliability )
The 1200 is the regression constant: it is the amount of weighted playing time at which you trust the player and the league equally. A full-time hitter with three healthy seasons piles up far more weighted plate appearances than that, so his reliability runs high — most of his projection is his own track record, with only a thin slice of league average mixed in. A part-timer gets yanked much harder toward the middle. In this demo the regression target is the real league OPS for 2025, which came out to .767.
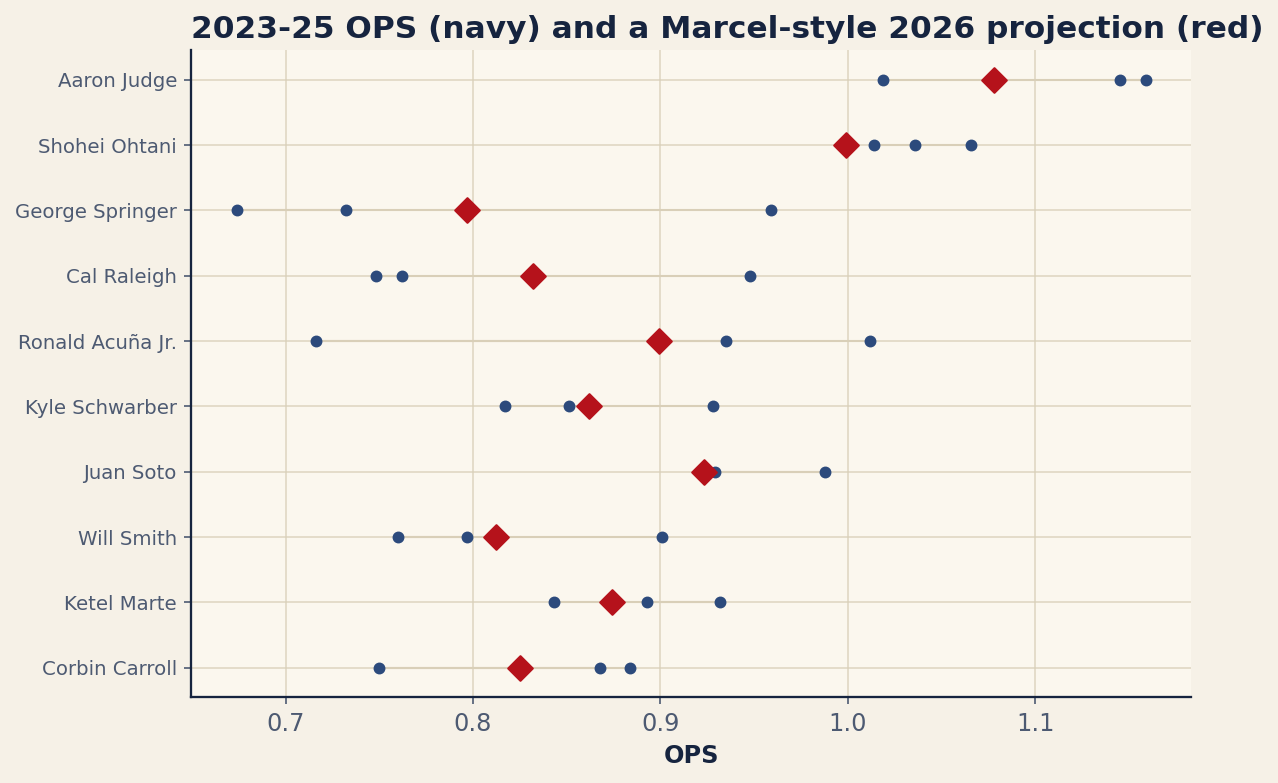
You can see the regression bite in the chart. Every red diamond — the 2026 projection — sits inside the player’s recent cluster of navy dots, never above the best of them. The forecast never predicts a new career year, because for any individual that is the low-probability bet. It pulls the outliers gently toward .767 and leaves the steady, league-average performers almost untouched.
Step three: a nod to age
The third ingredient is the one this demo handles most lightly, and I want to be honest about that. The classic Marcel adds a small age adjustment — roughly a boost for players on the way up to their late-twenties peak and a deduction for those past it — on the order of a few points of OPS per year of distance from peak. It is a real part of the recipe and it matters in aggregate, but it is small next to weighting and regression, and the version here discusses it rather than applying a per-player curve. Treat the projections in the table as “weighting plus regression,” with age as the acknowledged next layer.
| Player | 2023 OPS | 2024 OPS | 2025 OPS | 2026 proj |
|---|---|---|---|---|
| Aaron Judge | 1.019 | 1.159 | 1.145 | 1.078 |
| Shohei Ohtani | 1.066 | 1.036 | 1.014 | 0.999 |
| George Springer | 0.732 | 0.674 | 0.959 | 0.797 |
| Cal Raleigh | 0.762 | 0.748 | 0.948 | 0.832 |
| Ronald Acuña Jr. | 1.012 | 0.716 | 0.935 | 0.899 |
| Kyle Schwarber | 0.817 | 0.851 | 0.928 | 0.862 |
| Juan Soto | 0.929 | 0.988 | 0.921 | 0.923 |
| Will Smith | 0.797 | 0.76 | 0.901 | 0.812 |
| Ketel Marte | 0.843 | 0.932 | 0.893 | 0.874 |
| Corbin Carroll | 0.868 | 0.75 | 0.884 | 0.825 |
Run your eye down the table and the personality of the method shows. Judge’s blistering 1.145 in 2025 projects to 1.078 — still elite, but trimmed, because no one stays at 1.145. Ohtani’s 1.014 barely moves, to .999, since all three of his seasons agree and there is little for regression to argue with. The dramatic cases are the spikes: George Springer jumped from a .674 season to a .959 season, and Marcel, distrusting a one-year leap, lands the projection at .797 — far below the spike, comfortably above the slump. That is not the model being timid; that is the model knowing how often a .959 turns out to be a fluke.
Why the “dumb” baseline is so hard to beat
Here is the uncomfortable fact that keeps forecasters humble: Marcel, with its three crude rules, gets within shouting distance of the fancy systems most of the time. The reason is that the bulk of the predictive signal in a hitter’s future is his recent past, properly weighted and properly regressed. Everything else is refinement at the margins. That is why Tango offered it as a public benchmark — if your shiny new model can’t beat the monkey, it isn’t doing anything.
But the margins are where pennants are decided, and that is where the real systems earn their keep. ZiPS leans on large sets of comparable players to shape aging curves; Steamer blends component skills and regresses each at its own rate; PECOTA built its name on comparable-player “neighborhoods.” All of them add what Marcel pointedly ignores: park factors, proper aging curves, minor-league data translated to the majors, pitch-level inputs, and — crucially for fantasy and front offices alike — a forecast of playing time, not just rate of production. A great projected OPS over twenty plate appearances wins nobody anything.
What this teaches you about every forecast
The next time a projection lowballs your favorite slugger, you will know precisely why, because you have now built the mechanism by hand. The system is not predicting decline out of spite; it is reporting that an extreme season is, by definition, unlikely to repeat, and that the honest forecast lives between the player’s peak and the league’s mean. This is the same regression reflex that makes models cautious about hot starts in spring — see whether spring training predicts anything — and the same humility that explains why playoff-odds models disagree, since small differences in how each one regresses and ages its inputs compound across a 162-game schedule.
The bottom line
Marcel is a teaching tool, not a forecast you should bet on — it projects one stat, it skips park and defense, and it waves at aging rather than modeling it. But it captures the three moves at the heart of every projection system ever published: weight the recent past, distrust small samples, and respect the calendar. Understand those three, and ZiPS and Steamer stop looking like oracles and start looking like what they are — Marcel, with better data and sharper edges. The monkey was right about the important part.
Sources & Further Reading
- For the fundamentals, see Chapter 22: Correlation and Simple Linear Regression in DataField.dev’s free textbook library.
- Projection inputs: MLB.com (MLB Stats API, 2023–2025 hitting). Numbers retrieved June 2026; the simplified projection is re-runnable via
scripts/marcel_projection.py. - FanGraphs — home of the ZiPS and Steamer projections and the original Marcel benchmark write-ups by Tom Tango.
- Baseball-Reference — season-by-season OPS and playing-time histories for context.