There’s an old baseball saying that pitching is fickle and hitting is what you can count on — that a lineup is a stable asset and a pitching staff is a health-and-luck lottery you re-run every April. It’s a reasonable-sounding intuition, and at the level of an individual arm there’s something to it. But asked as a team question — if you want to bet on what a club will be next year, is its offense or its run prevention the safer thing to project? — the real data says the intuition is backwards. Across four recent seasons, a team’s run prevention carried into the next year almost twice as reliably as its run scoring did.
Here is the finding, computed on 90 consecutive-season pairs from 2021 through 2024: runs allowed per game carried over year to year at r = 0.50, while runs scored per game carried at just r = 0.28. Defense — in the broad sense of pitching plus fielding plus park — is the stickier skill. Offense is the volatile one. If you had to guess one side of a team’s ledger for next season knowing only this season, you’d bet the run prevention with far more confidence.
The method
The setup mirrors the one behind our finding on whether last year predicts this year, just split into offense and defense. Take every team’s full-season standings for 2021, 2022, 2023, and 2024. Convert to per-game rates so the numbers are comparable — runs scored per game and runs allowed per game, each divided by that team’s games played. Then form consecutive-season pairs: each team’s 2021 next to its 2022, its 2022 next to its 2023, its 2023 next to its 2024. That’s 90 pairs (30 teams × 3 transitions). For each side of the ball, correlate the “this year” rate against the “next year” rate. The strength of the year-to-year memory falls right out.
A correlation near 1.0 would mean a side of the ball is a fixed trait — whatever you were this year, you’ll be next year. A correlation near 0 would mean it’s essentially re-rolled from scratch each season. The two numbers below sit at very different points on that line.
The result: run prevention is stickier
Here are the two carryover correlations side by side, with team winning percentage included as a benchmark:
| Team trait, year N → N+1 | r | R² |
|---|---|---|
| Runs allowed / game (run prevention) | 0.50 | 0.25 |
| Winning percentage (whole team) | 0.54 | 0.29 |
| Runs scored / game (offense) | 0.28 | 0.08 |
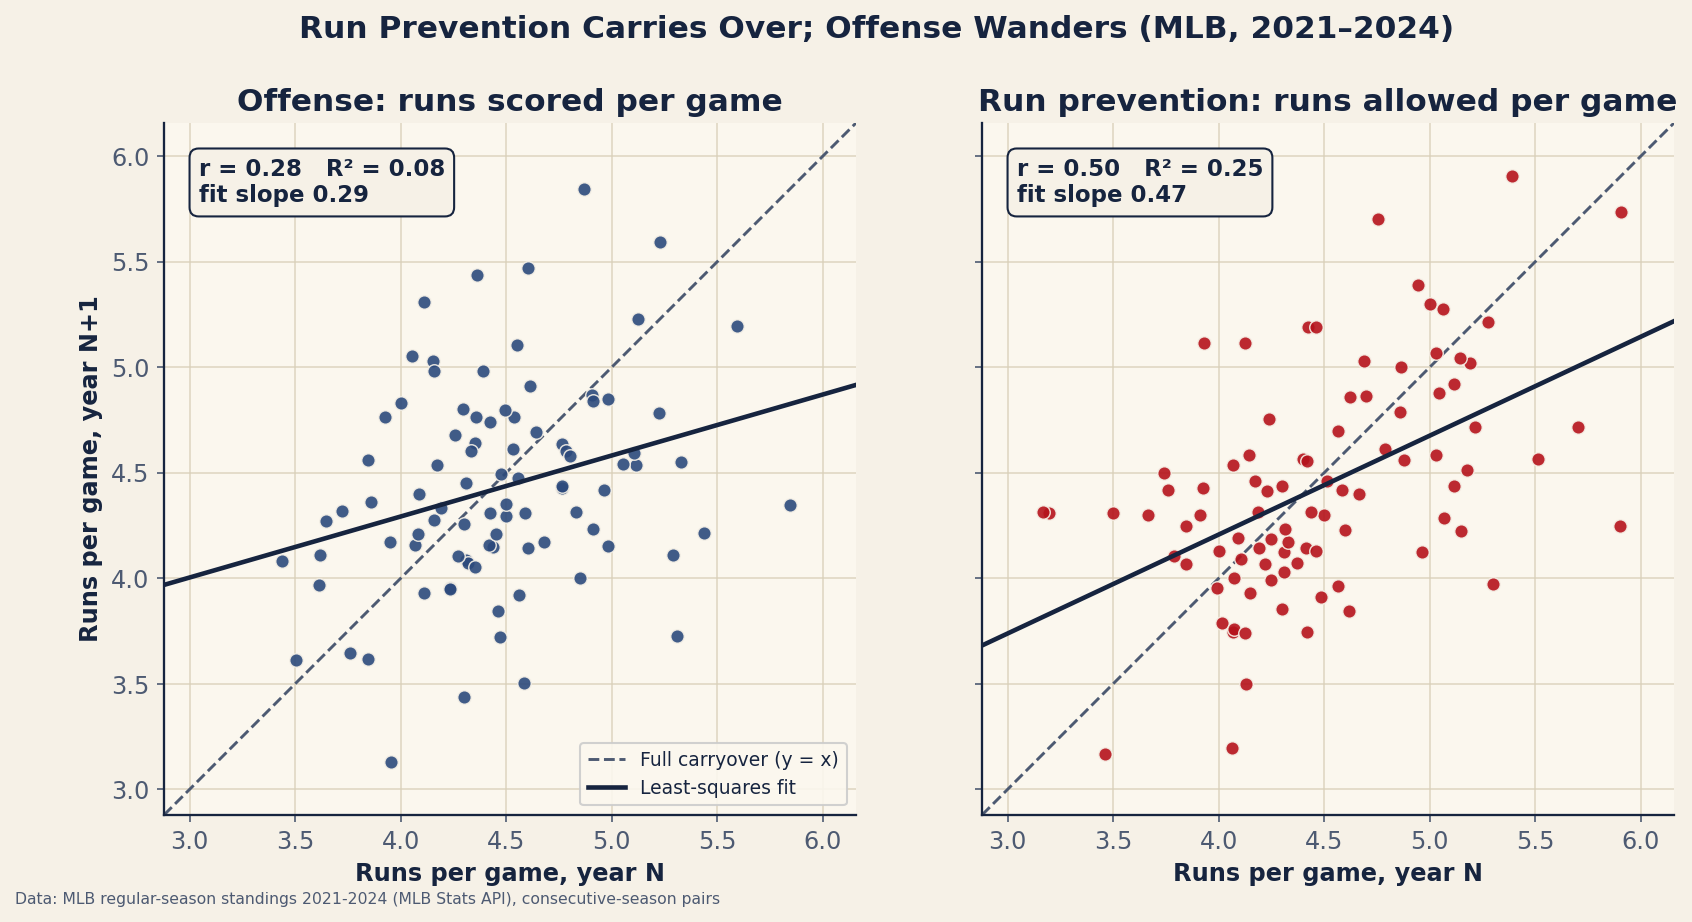
The gap is stark. Run prevention carries over at r = 0.50 — last year’s run prevention explains about 25% of next year’s. Offense carries at r = 0.28, explaining barely 8%. In other words, knowing a team’s run prevention this season tells you roughly three times as much about next season (in variance-explained terms) as knowing its offense does. And notice that run prevention (0.50) sits close to the whole team’s win% carryover (0.54), while offense (0.28) lags well behind both. The stable core of a team’s identity, year to year, is the run-prevention side.
The regression slopes tell the same story from another angle. Fit next year’s rate on this year’s and offense regresses harder toward the league mean: the runs-scored slope is about 0.29, the runs-allowed slope about 0.47. A team with an elite offense keeps only about a third of its edge next year; a team with elite run prevention keeps closer to half. Both regress — everything in baseball regresses — but offense regresses more violently.
A team that shows the pattern
The 2023-to-2024 Rays are the cleanest single illustration we found in the data. In 2023 they scored a robust 5.31 runs per game; in 2024 that cratered to 3.73 — a collapse of more than a run and a half per game, the largest offensive swing in baseball. Their run prevention over the same span? It moved from 4.10 to 4.09 runs allowed per game. Essentially unchanged.
Rays, runs scored/game:   2023  5.31  ->  2024  3.73   (down 1.58)
Rays, runs allowed/game:  2023  4.10  ->  2024  4.09   (down 0.01)
One team, one offseason, and the two sides of the ledger behaved like completely different kinds of quantity: the offense was a leaf in the wind, the run prevention a rock. That’s an anecdote, not proof — the Braves’ offense also fell about a run and a half while their run prevention actually improved — but it’s the shape the 90-pair correlations describe in aggregate. Offenses lurch; run-prevention units hold.
Why run prevention holds and offense wanders
The result is counterintuitive if you’re thinking about individual pitchers, whose ERAs bounce around wildly with health and luck. But “runs allowed” at the team level is a broader, calmer thing than any one arm:
- Park is baked in, and parks barely move. A big share of team runs allowed is the ballpark — Coors will inflate it every year, a pitcher’s park suppress it every year. That fixed park factor is a permanent anchor on the run-prevention number that partly props up its year-to-year correlation. Offense sits in the same park, of course, but…
- Offense is more sequencing-dependent. Team runs scored depends heavily on whether hits and walks cluster into rallies, and clustering is close to random from year to year — the cluster-luck problem. That timing noise gets re-rolled every season, dragging the offensive carryover down.
- Defense pools more contributors. Run prevention spreads across an entire pitching staff and eight fielders; no single injury or slump swings the team total as hard as a couple of hitters’ down years can swing a lineup’s output.
- Regression to the mean does the rest. Both sides get pulled toward the league average, which is the engine of all of this — see regression to the mean — but offense, carrying more luck in its raw total, gets pulled harder.
Where this read has limits
We want to be careful not to oversell a four-season result:
- 90 pairs is a modest sample, and the window is unusual. 2021–2024 spans real rule changes (the shift ban, bigger bases) that reshaped offense specifically. A longer window might narrow the gap. Multi-decade studies do generally find run prevention at least as sticky as run scoring, so the direction is trustworthy even if the exact numbers aren’t universal.
- Park inflates the run-prevention correlation. Some of that 0.50 is just “the same team plays in the same park,” not “pitching-and-defense talent persists.” The offense number is dampened by the same park stability, so the comparison isn’t perfectly clean. A park-adjusted version would shrink both correlations and probably narrow the gap somewhat — but it’s unlikely to flip it.
- This is team-level, not player-level. The old “pitching is fickle” saying is really about individual pitchers’ ERAs, which are volatile. Aggregating to the team staff plus defense is exactly what calms the number down. Both things can be true.
- Carryover isn’t causation. A high correlation reflects roster continuity and front-office strategy as much as any inherent property of “run prevention” — teams that build around pitching and defense tend to keep doing so.
What it means for projecting a team
The practical upshot is a small correction to how you read an offseason. When a team rode a monster offense to a big year, discount it harder — offense is the side most likely to fall back, and a lineup that scored its way to 90 wins is a shakier bet to repeat than a staff that prevented its way there. When a team’s identity is run prevention, trust it a little more. This is the kind of asymmetry a good projection system already encodes: it doesn’t just regress last year’s record, it regresses the components at different rates, leaning on the fact that a team’s run differential and its parts each carry their own reliability. The naive move — assume a team’s offense and defense are equally repeatable — is the one the data says to stop making. For how those systems actually weight and regress inputs, see how projection systems work.
The bottom line
Split a team into its two halves and they don’t age the same. From one season to the next, run prevention carried over at r = 0.50 and offense at just r = 0.28 — run prevention is close to twice as reliable, and it tracks the whole team’s year-to-year stability far more closely than offense does. Some of that edge is park sitting inside the run-prevention number, and some is that team offense carries more sequencing luck that re-rolls every year. But the headline survives the caveats: at the team level, the steady thing is run prevention, and the wandering thing is the bats. The old wisdom about fickle pitching was watching the wrong unit.
Reproduce it
The standings are bundled in data_layer/standings_multiseason.json (full regular-season records with runs scored and allowed, 2021–2024, MLB Stats API, retrieved 2026-06-20). Convert to per-game rates, pair each team’s consecutive seasons on team_id, then compute corr(RS/g_year, RS/g_next) and corr(RA/g_year, RA/g_next), plus the least-squares slopes. No network, nothing hand-entered.
Sources & Further Reading
- Regular-season standings with runs scored/allowed 2021–2024: bundled
data_layer/standings_multiseason.json, pulled from the MLB Stats API (retrieved 2026-06-20). - SABR and the FanGraphs Library — research on the year-to-year reliability of team offense versus run prevention.
- Related: Does last year predict this year and run differential predicts next year — the whole-team version of this carryover question.
- Related: Regression to the mean and how projection systems work — why components regress at different rates.