The Pythagorean win expectation is the most useful formula in baseball, and almost everyone who quotes it gets one detail on faith. You take a team’s runs scored and runs allowed, raise them to a power, and out comes how many games the team “should” have won. That power — the exponent — is where the faith lives. Bill James originally used 2. The modern convention is 1.83. I’ve always wanted to know what the data itself prefers, so I stopped assuming and fit the exponent to a real season. Here’s the finding: for the 30 teams of 2023, the best-fit exponent is 1.69 — lower than both textbook values — and it barely matters at all. That second clause is the actual lesson.
The formula, and the one free parameter
Pythagorean expected wins are:
expected wins = games × RS^k / (RS^k + RA^k)where RS is runs scored, RA is runs allowed, and k is the exponent. The shape is the whole idea: outscore your opponents and your expected win total climbs, steeply near .500 and flattening at the extremes. James picked the name because RS² / (RS² + RA²) looks like the Pythagorean theorem; the squared version was a first guess, not a derived truth. People later noticed that a slightly smaller exponent tracked actual records a touch better, and 1.83 became the house number on Baseball-Reference and in most analysis you’ll read. But “a touch better” on what data, by how much? That’s answerable.
Let the season pick the exponent
The method is brute-force and honest: take every 2023 team’s real RS, RA, and games, compute expected wins across a whole range of exponents, and for each exponent measure the root-mean-square error against what teams actually won. The exponent that minimizes that error is the one 2023 “wanted.” No assumption goes in; the standings decide.
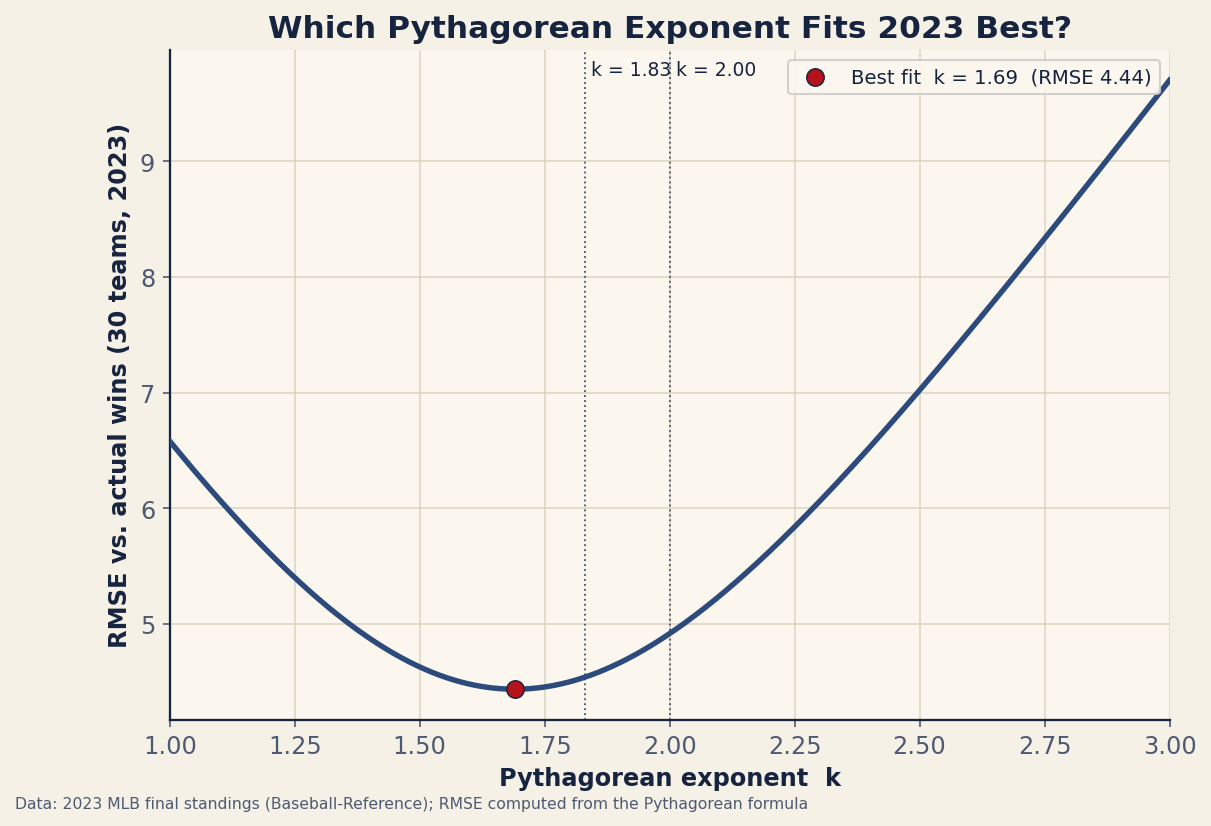
Two things jump out of that curve. First, the minimum sits at k = 1.69, not at 1.83 or 2. Second — and this is what matters — the curve is shallow near the bottom. The error at the textbook 1.83 is 4.54 wins; at the best-fit 1.69 it’s 4.44. You buy yourself one-tenth of a win of average accuracy by abandoning the standard exponent for a hand-fit one. Across 30 teams, that is nothing.
| Exponent | Where it comes from | 2023 RMSE (wins) |
|---|---|---|
| 1.50 | A deliberately low value | 4.63 |
| 1.83 | Modern sabermetric standard | 4.54 |
| 2.00 | Bill James's original exponent | 4.92 |
| 1.69 | Best fit to 2023 (this analysis) | 4.44 |
James’s original 2.0 is the worst of the three at 4.92 wins of error, which is the kernel of truth behind the move to 1.83 — squaring slightly overstates how much a big run differential should translate into wins. But notice the whole table lives between 4.4 and 4.9 wins of error. The exponent is a knob that, within any sane range, hardly turns the machine.
A worked example — and why the exponent fools you on the good teams
Take the 2023 Braves: 947 runs scored, 716 allowed, 162 games, and an actual 104 wins. Run their numbers at each exponent:
k = 1.69 -> 162 × 947^1.69 / (947^1.69 + 716^1.69) = 99.8 wins
k = 1.83 -> 101.3 wins
k = 1.89 -> 101.9 wins
k = 2.00 -> 103.1 wins
Here is the twist the league-wide fit hides. For the Braves, the exponent matters a lot — a 3.3-win spread from 99.8 to 103.1 — and the value that fits the whole league best (1.69) fits the Braves worst. They actually won 104, closest to James’s much-maligned 2.0. That’s not a coincidence: a bigger exponent rewards large run differentials harder, so it flatters dominant teams and punishes them less for blowout-inflated run totals. The 1.69 minimum wins the season because most of the league clusters near .500, where the exponent barely moves the answer, and a handful of extreme teams quietly get worse estimates. An exponent fit to all 30 teams is a compromise that fits none of the interesting ones especially well. Plug the Braves into the Pythagorean calculator below and you can watch the estimate slide as you change the inputs.
Interactive tool
Pythagorean Win Expectation
Expected winning percentage and a projected W–L record from runs scored and runs allowed. This interactive calculator needs JavaScript; the formula and explanation above work without it.
The grown-up answer: don’t use a constant at all
If the best exponent shifts with how extreme a team is, it should also shift with the run environment — and it does. The refinement the field actually settled on is Pythagenpat (David Smyth and Clay Davenport’s related Pythagenport), which makes the exponent a function of scoring: k = (runs per game)^0.287. In a high-scoring era each run is worth a little less, so the exponent rises; in a pitchers’ era it falls. For 2023, the league averaged 9.23 runs per game, which Pythagenpat turns into an exponent of 1.89 — essentially right back to the textbook neighborhood. That’s the reassuring part: the static 1.83 works because it’s a sensible average of what a variable exponent would give you across normal modern run environments. The constant is a shortcut for the formula that’s actually correct, not a rival to it.
Where this breaks
I want to be clear about how little this proves:
- One season, thirty points. A best-fit of 1.69 from 30 teams is itself a noisy estimate. Run 2022 or 2021 and the minimum will land somewhere else — often above 1.83. Pooling many seasons is the only way to pin an exponent down, and that pooled answer is roughly the 1.83–1.85 the convention already uses. The single-season “winner” is mostly an artifact of that year’s extreme teams.
- The exponent isn’t the error. Even at its best, the formula misses some teams by a lot — the 2023 Padres won 10 fewer games than expected and the Marlins about 9 more. No exponent fixes that. Those residuals are timing: record in one-run games, bullpen sequencing, the cluster luck that decides which runs actually turned into wins. The exponent argument is a rounding-error debate happening on top of a much larger, more interesting source of miss.
- It’s descriptive, not predictive. Fitting the exponent to a finished season tells you what already happened. For projecting next year you want the stable, run-environment-aware version, not a number reverse-engineered from one set of final standings.
Reproduce it
Everything here comes from one CSV of 2023 final standings and the formula above. The sweep is a few lines: for each candidate k, compute games × RS^k / (RS^k + RA^k) for all 30 teams, take the RMSE against actual wins, and keep the k with the smallest error. The curve, the best-fit point, and the comparison table are regenerated by charts/chart_pythag_exponent_fit.py against the bundled data_layer/standings_2023.csv — no network, nothing hand-entered. Point it at another season’s standings and it will tell you that year’s “best” exponent, and almost certainly that it didn’t matter much either.
Sources & Further Reading
- 2023 final standings (G, W, RS, RA): bundled
data_layer/standings_2023.csv, swept bycharts/chart_pythag_exponent_fit.py(data from Baseball-Reference). - Bill James — the original Pythagorean win expectation (exponent 2) from the Baseball Abstract; the 1.83 refinement is documented at Baseball-Reference.
- David Smyth / “Patriot” (Pythagenpat) and Clay Davenport (Pythagenport) — the run-environment-dependent exponent, via SABR and Baseball Prospectus.
- Related: The luckiest and unluckiest teams of 2023 — the residuals no exponent fixes.
- Related: Offense or defense: what won in 2023? — the runs-to-wins relationship underneath this.
- Related: Build a run-differential power ranking — the same engine, applied.