Every league swears it has parity. The honest way to check is to stop arguing about it and measure it — and there’s a clean, decades-old way to do exactly that. Here’s the finding for 2023: Major League Baseball was roughly twice as top-heavy as a perfectly balanced league would be. The spread between the good teams and the bad ones was about double what you’d see if every club were identical and every game a coin flip. The number that says so is the Noll-Scully ratio, and for 2023 it comes out to 2.03.
The trick: compare the real spread to an impossible one
You can’t judge competitive balance from the standings alone, because you need something to compare against. What does “balanced” even look like? The insight, from economists Roger Noll and Gerald Scully, is that there’s a precise answer: imagine a league where every team is exactly equal, so every game is a 50/50 coin flip. Teams would still finish with different records — luck alone separates them — but only by so much. Over a 162-game season, coin-flip win totals follow a binomial distribution, and the standard deviation of winning percentage in that idealized league is an exact formula:
ideal SD = 0.5 / √G = 0.5 / √162 ≈ 0.039
That’s about 6.4 wins of natural spread — the irreducible scatter you’d get even if no team were better than any other. The Noll-Scully ratio is just the actual spread divided by that ideal:
Noll-Scully = (actual SD of win%) / (ideal SD)
A ratio of 1.0 means a league no more spread out than pure luck — perfect parity. The higher it climbs, the more the standings reflect real, persistent quality gaps rather than chance.
2023, measured
Run it on the real 2023 final standings. The actual standard deviation of the 30 teams’ winning percentages was 0.080 — about 12.9 wins. Divide by the idealized 0.039 and you get a Noll-Scully ratio of 2.03. The league’s real spread of outcomes was almost exactly twice what a coin-flip league would produce.
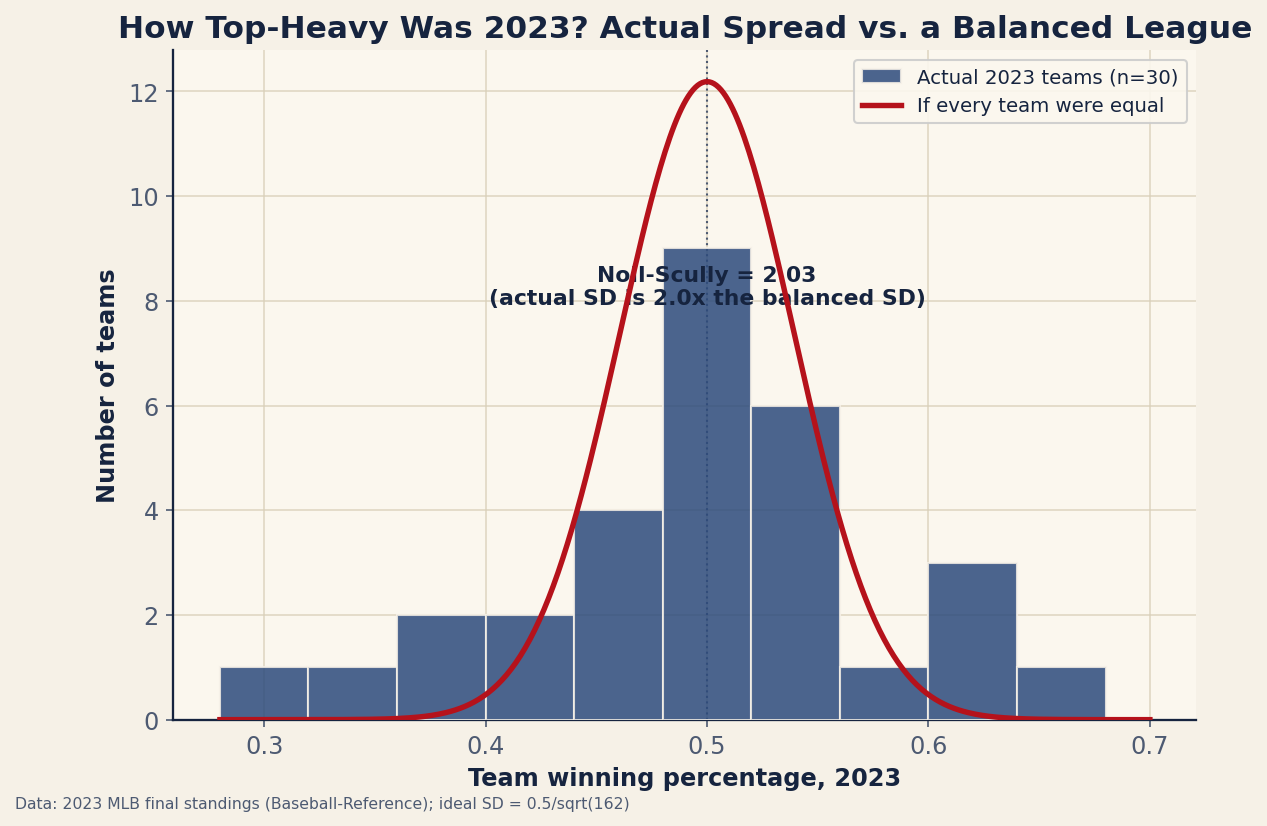
The chart makes the gap tangible. The navy bars are the 30 actual teams; the red curve is the narrow bell a perfectly balanced league would produce, centered on .500. The real distribution is dramatically wider — it has 104-win Braves and 50-win A’s out in tails the balanced bell never reaches. That extra width, beyond what luck can explain, is the measurable signature of teams that are genuinely, durably different in quality.
| Measure | SD of win% | SD in wins |
|---|---|---|
| Actual spread of team win% (2023) | 0.080 | 12.9 |
| Ideal spread if every team were equal | 0.039 | 6.4 |
| Noll-Scully ratio (actual / ideal) | 2.03 | — |
What a 2.03 actually means
The ratio has a clean interpretation: about half of the spread in the 2023 standings was real talent and about half was the noise any season carries. More precisely, because variances add, you can decompose it. The total variance in win% is the talent variance plus the luck variance. The luck part is the idealized 0.039²; the total is the observed 0.080². Subtract and the talent standard deviation works out to about 0.069 — meaning the genuine quality gap between teams (roughly 11 wins of spread) is larger than the luck gap (6.4 wins), but not by as much as the raw standings make it look. Even the 2023 Braves were a bit lucky and the A’s a bit unlucky on top of being good and bad.
This is the same luck-versus-talent split that drives regression to the mean and shows up team-by-team as the luckiest and unluckiest clubs. Noll-Scully is just that decomposition done at the league level instead of the team level.
Why baseball’s number is low — on purpose
A 2.0-ish ratio is, by the standards of pro sports, balanced. The NBA routinely posts Noll-Scully ratios north of 3; the NFL, despite its parity branding, tends to land near 1.5 mostly because a 17-game season is too short for talent to fully separate from luck. Baseball sits in between, and two structural features hold it there. First, the 162-game season is long enough that luck washes out and talent shows — which, counterintuitively, makes the standings more spread out than a short season would, because the good teams stop getting dragged back to .500 by small samples. Second, baseball is a high-variance game play to play: even the best team loses about a third of its games, which compresses the standings compared to basketball, where the better team wins far more reliably. The season length pushes the spread up; the game’s inherent randomness pulls it down. A ratio around 2 is where those forces settle.
Where this measure breaks
Noll-Scully is a single number doing a big job, and it has real blind spots:
- One season is noisy. A 2.03 from 30 teams in a single year will bounce around — some seasons land at 1.8, others at 2.3, without the underlying competitive structure changing much. Trends matter more than any one year’s figure; you want a decade of ratios to say balance is rising or falling.
- It ignores which teams are good. The same ratio results whether the same three juggernauts dominate every year or a different set rises each season. Balance-of-outcomes (the spread in a single year) is not the same as balance-of-opportunity (whether everyone gets a turn). A league can have a low Noll-Scully and still be stale if it’s the same teams on top every time.
- Unbalanced schedules muddy it. The formula’s idealized SD assumes every team plays a common, neutral slate. Real schedules aren’t balanced — a team buried in a strong division faces tougher competition than its record alone reflects, which inflates the apparent spread a little.
- It says nothing about cause. A high ratio doesn’t tell you why — payroll disparity, a tanking cluster, or just a year with a few historically good and bad teams all read the same. Noll-Scully measures the symptom, not the diagnosis.
Reproduce it
This is one CSV and two lines of arithmetic. Take the 30 teams’ winning percentages from the bundled standings, compute their standard deviation, and divide by 0.5 / sqrt(162). The histogram, the idealized bell, and the ratio are regenerated by charts/chart_competitive_balance.py against data_layer/standings_2023.csv — no network, nothing hand-entered. Point it at any season’s standings (adjusting the games-per-season constant) and it will tell you how balanced that year was.
Sources & Further Reading
- 2023 final standings and win percentages: bundled
data_layer/standings_2023.csv, computed bycharts/chart_competitive_balance.py(data from Baseball-Reference). - Roger Noll and Gerald Scully — the actual-to-ideal standard-deviation ratio for competitive balance, developed in the sports-economics literature; the idealized binomial SD of 0.5/√G is its foundation.
- Related: Regression to the mean and the luckiest and unluckiest teams of 2023 — the same luck-versus-talent split at the team level.