Here is the finding first, because it’s the whole article: in 2023, run prevention tracked winning a little more tightly than run scoring did. Across all thirty teams, a club’s wins correlated with its runs allowed at r = −0.82 and with its runs scored at r = +0.78. Flip the signs to make them comparable — fewer runs allowed is good, more runs scored is good — and defense wins the tiebreaker by four hundredths of a correlation point. Squared into the share of variance each side explains, that’s 67% for run prevention against 61% for offense.
It’s a real edge, and it’s a small one. Four hundredths is the kind of gap that can flip with a different season or a different thirty teams. So before anyone walks away with “defense wins championships” carved in stone, the honest headline is the one almost nobody says out loud: the thing that actually predicted 2023 wins wasn’t offense or defense. It was the difference between them — run differential — which correlated with wins at r = +0.94 and made the offense-versus-defense argument mostly beside the point.
What the two correlations actually say
Start with what a correlation is measuring here. Each of the thirty 2023 teams is one dot. For the offense question I line up every team’s runs scored against its wins and ask how tightly the two move together; for the defense question I do the same with runs allowed. The correlation coefficient r runs from −1 to +1: a +1 would mean runs scored predicts wins perfectly, a 0 would mean it tells you nothing. Square it and you get R², the fraction of the variation in wins that the one variable can account for.
Run that against the bundled standings and offense comes back at r = +0.78 (R² = 0.61): teams that scored more generally won more, and runs scored alone explains about 61% of the spread in wins. Defense comes back at r = −0.82 (R² = 0.67): the negative sign just says that allowing more runs goes with fewer wins, and runs allowed alone explains about 67%. The magnitudes are what matter, and 0.82 is bigger than 0.78. In 2023, knowing a team’s run prevention told you slightly more about its record than knowing its offense did.
Here is the exhibit — both questions side by side, one dot per real team, each panel carrying its fitted line and its actual r and R²:
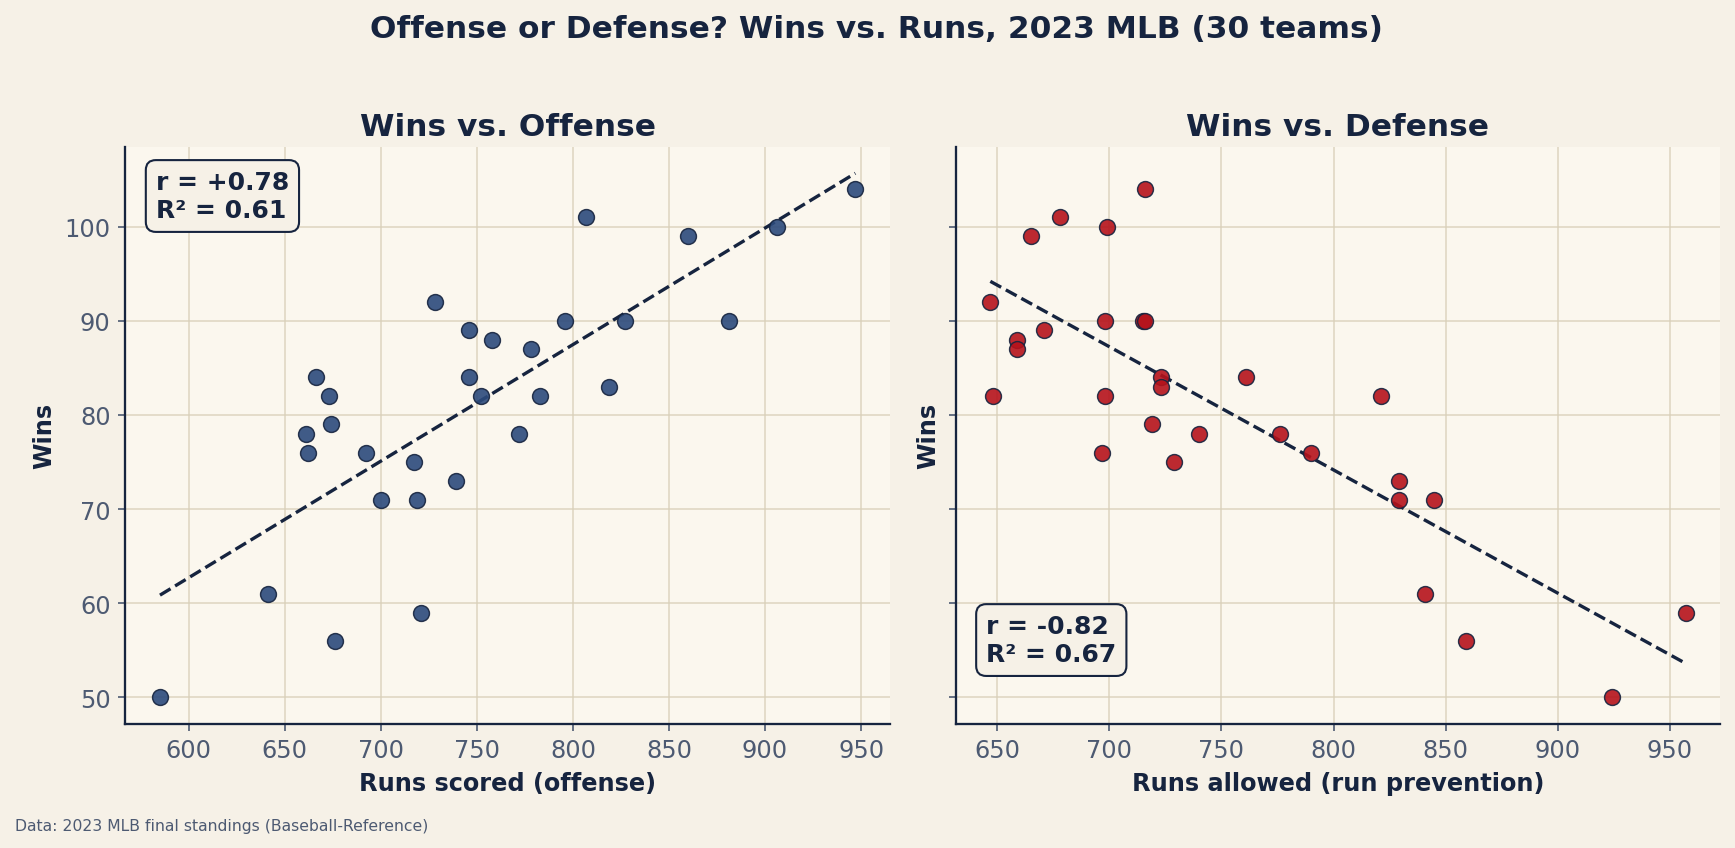
Look at the two clouds rather than the numbers for a second. Both clearly slope the right way — offense up, defense down — and both have plenty of scatter, because no single side of the ledger wins games by itself. The right-hand cloud just hugs its line a hair more closely. The A’s anchor both panels: 585 runs scored (the league’s worst offense) and 924 allowed (its worst defense), bottoming out at 50 wins. The Braves anchor the top with 947 scored, while the Rays’ 665 allowed shows what an elite run-prevention season looks like.
Why run differential ties the whole thing together
The offense-versus-defense framing has a hidden flaw, and it’s worth naming: a run scored and a run prevented are the same thing in the standings. Both move your run differential by one. A lineup that adds 30 runs and a pitching staff that saves 30 runs do identical work toward winning — they each push the run differential up by 30. That’s why neither correlation cracks 0.85 on its own but their combination, run differential, jumps to r = +0.94 (R² = 0.89). Differential explains 89% of the variation in wins, far more than either ingredient alone, because it stops double-counting and just measures the net.
So the reason run prevention “won” 2023 by four hundredths isn’t some deep truth that defense is more valuable than offense. It’s mostly that in this particular season, the spread in team run prevention happened to be a touch wider and cleaner than the spread in offense — the worst defenses (Colorado’s 957 runs allowed, Oakland’s 924) were further from the pack than the worst offenses. A run is a run. Differential is the honest scoreboard, and it’s the number a run-differential power ranking is built on for exactly this reason.
A worked example: pricing the Braves’ runs into wins
Let’s turn the abstract correlation into one concrete team. Fit a straight line of wins on run differential across all thirty 2023 clubs and you get a tidy result: the line passes through 81 wins at a differential of zero (exactly .500, as it must), and its slope is about 0.0885 wins per run of differential — which inverts to the famous rule of thumb that it takes roughly ten to eleven runs to buy a win.
Now take the Atlanta Braves. They scored 947 runs and allowed 716, for a run differential of +231. Drop that into the line:
predicted wins = 81 + 0.0885 × 231
              = 81 + 20.4
              = 101.4 wins
The Braves actually won 104. The line missed by about three wins — they slightly outperformed their differential — but it landed within a rounding error of a 104-win juggernaut using nothing but the gap between their runs scored and allowed. That’s the same engine the Pythagorean win expectation runs on, just curved instead of straight; feed the Braves’ 947 and 716 into the calculator below and it returns 101.3 expected wins, within a tenth of the linear estimate.
Interactive tool
Pythagorean Win Expectation
Expected winning percentage and a projected W–L record from runs scored and runs allowed. This interactive calculator needs JavaScript; the formula and explanation above work without it.
Where this breaks — and it breaks in several places
I have to be blunt about the limits, because a four-hundredths gap invites overclaiming. The first problem is sample size. This is one season and thirty data points. Thirty points is a small sample for a correlation, and the difference between 0.78 and 0.82 sits comfortably inside the wobble you’d expect from season to season. Run the identical analysis on 2022 or 2021 and offense might edge defense; pool a decade and the two tend to come out close to even, because over the long run a run saved and a run scored really are worth the same. Anyone who tells you a single season settles the offense-versus-defense debate is selling you noise as signal.
The second problem is that correlation isn’t causation, and the direction here is genuinely murky. Good teams win and outscore opponents because they’re good — the runs and the wins share a common cause (talent) rather than one cleanly driving the other. Both correlations are partly just “better teams are better at everything.” The differential’s 0.94 is high precisely because it captures total quality, not because differential mechanically produces wins.
Third, raw runs scored and allowed are context-dependent in ways these totals ignore. Colorado’s 957 runs allowed and 721 scored are both warped by Coors Field’s thin air, which inflates everything hit or thrown there — a real effect that park factors exist to strip out. The 2023 run environment, the rule changes, and each team’s schedule all sit unadjusted inside these numbers. And runs scored is itself partly a sequencing artifact: a lineup’s total depends on whether its hits clustered into rallies or scattered, which is the territory of BaseRuns and cluster luck. The wins themselves carry timing luck on top of that, the gap the luckiest and unluckiest teams of 2023 are made of. None of that is visible in a season-total correlation.
So what actually won in 2023?
The defensible reading is narrow and, I think, more useful than a slogan. In 2023, run prevention correlated with winning slightly more tightly than offense did — 0.82 to 0.78, 67% of the variance to 61%. That’s a real measurement, not a fluke of one team, but it’s a thin edge that I wouldn’t extrapolate past this season or this league.
The bigger, sturdier finding underneath it is that the question itself is slightly wrong. Offense and defense aren’t rivals competing to win games; they’re two inputs to one quantity, and that quantity — run differential, at r = 0.94 — is what predicted 2023 wins. A run saved by the bullpen and a run added by the lineup land in the same column of the same ledger. The 2023 season didn’t reward defense over offense so much as it rewarded, overwhelmingly, the teams that were further ahead on the net — whichever side of the ball got them there.
Reproduce it yourself
Every number here comes from one CSV of 2023 final standings and a few lines of arithmetic. The two correlations are corr(W, RS) and corr(W, RA); the run-differential figure is corr(W, RunDiff); the worked example fits W ~ RunDiff by least squares. The scatter exhibit, both fit lines, and the printed r / R² are regenerated by charts/chart_offense_vs_defense.py against the bundled data_layer/standings_2023.csv — no network, no hand-entered values, nothing invented. Swap in another season’s standings and the same script will tell you whether that year rewarded offense or defense.
Sources & Further Reading
- 2023 final standings, runs scored/allowed, and run differential: bundled
data_layer/standings_2023.csv, charted bycharts/chart_offense_vs_defense.py(data from Baseball-Reference). - Bill James — run differential as the basis of the Pythagorean win expectation, introduced in the Baseball Abstract; the “ten runs per win” rule of thumb traces to the same run-differential work, via SABR.
- Baseball-Reference — runs scored, runs allowed, and the Pythagorean W-L column published for every team and season.