Two teams both go 7−3 over their last ten. One did it winning a string of one-run nail-biters; the other did it in blowouts. The record is identical, but the teams are not — one is borrowing wins it can’t repeat. Win-loss record is the scoreboard everyone reads, and it is also the most overrated number on a standings page. The stat that quietly sees through it is the oldest trick in sabermetrics: run differential, runs scored minus runs allowed.
You don’t need a programming language to use it. You need a spreadsheet, two columns of numbers, and one formula that Bill James reverse-engineered from physics envy. By the end of this you’ll be able to build a 30-team power ranking for any season, and — more usefully — spot which contenders are living on luck before the regression to the mean arrives to collect.
Why run differential beats record
The logic is almost embarrassingly simple. Over a long season, the runs you score and the runs you allow are produced by hundreds of independent events; your record is produced by how those runs happened to clump into individual games. Clumping is largely noise. A team that wins its close games and loses its blowouts will outrun its run differential for a while, but that timing is not a repeatable skill — so next season, and often next month, the record drifts back toward what the run differential predicted all along.
That is why front offices and forecasters lean on run differential: as a predictor of future winning percentage, it consistently beats current winning percentage. To see what the finished ranking looks like, here is the same calculation run on a completed season — all thirty teams from 2023, sorted best to worst — before we build the live version below.
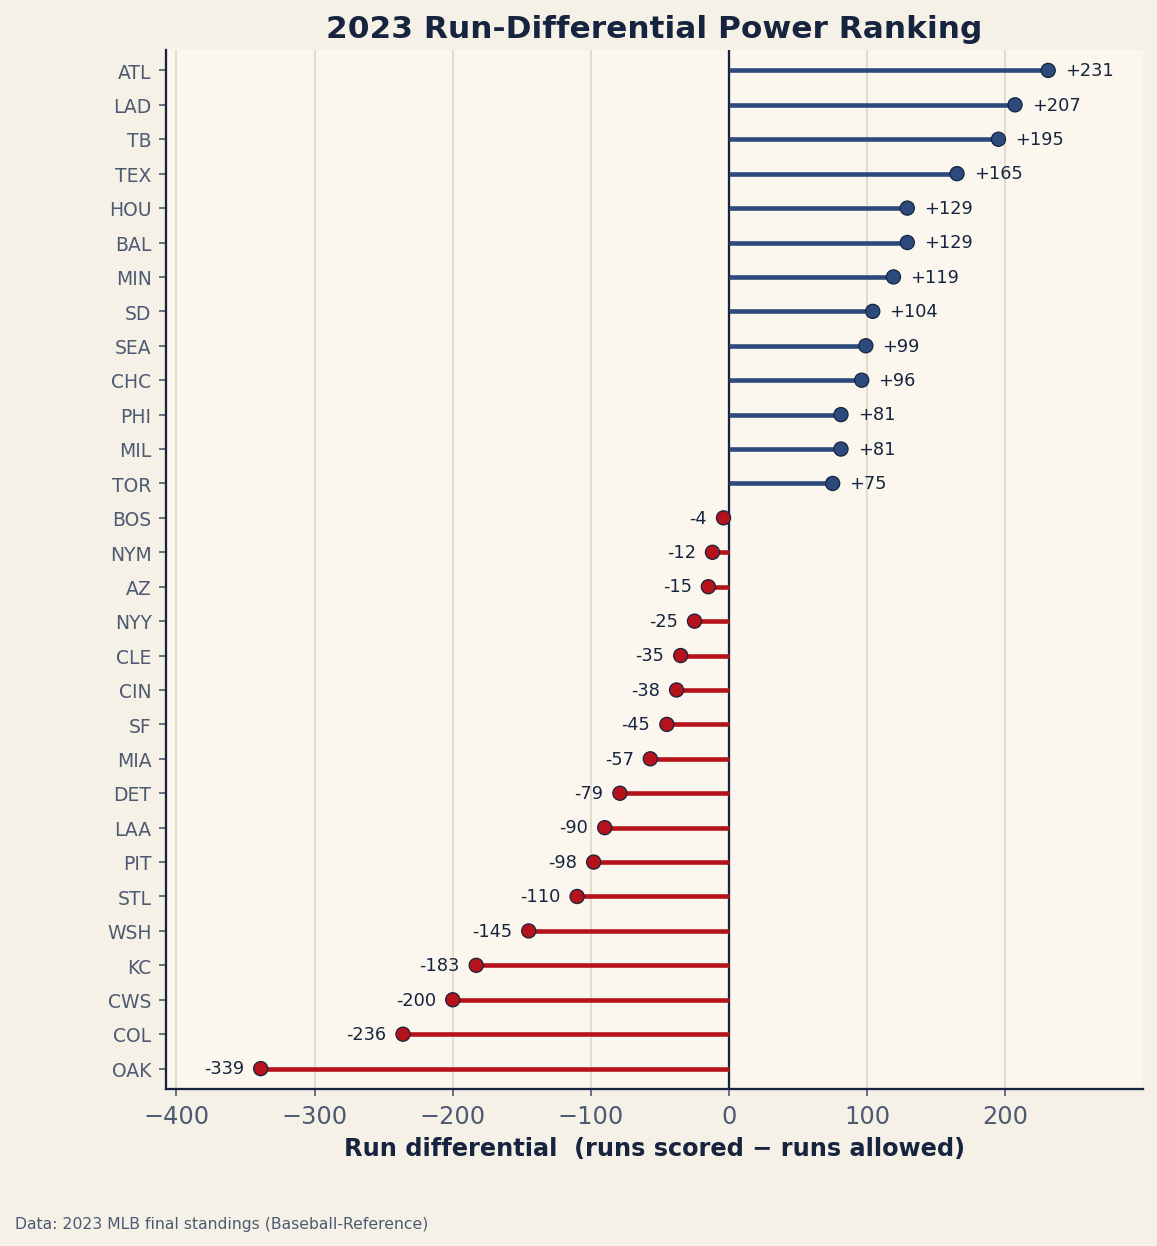
That spread is enormous, and the live version below shows the current season with the same method.
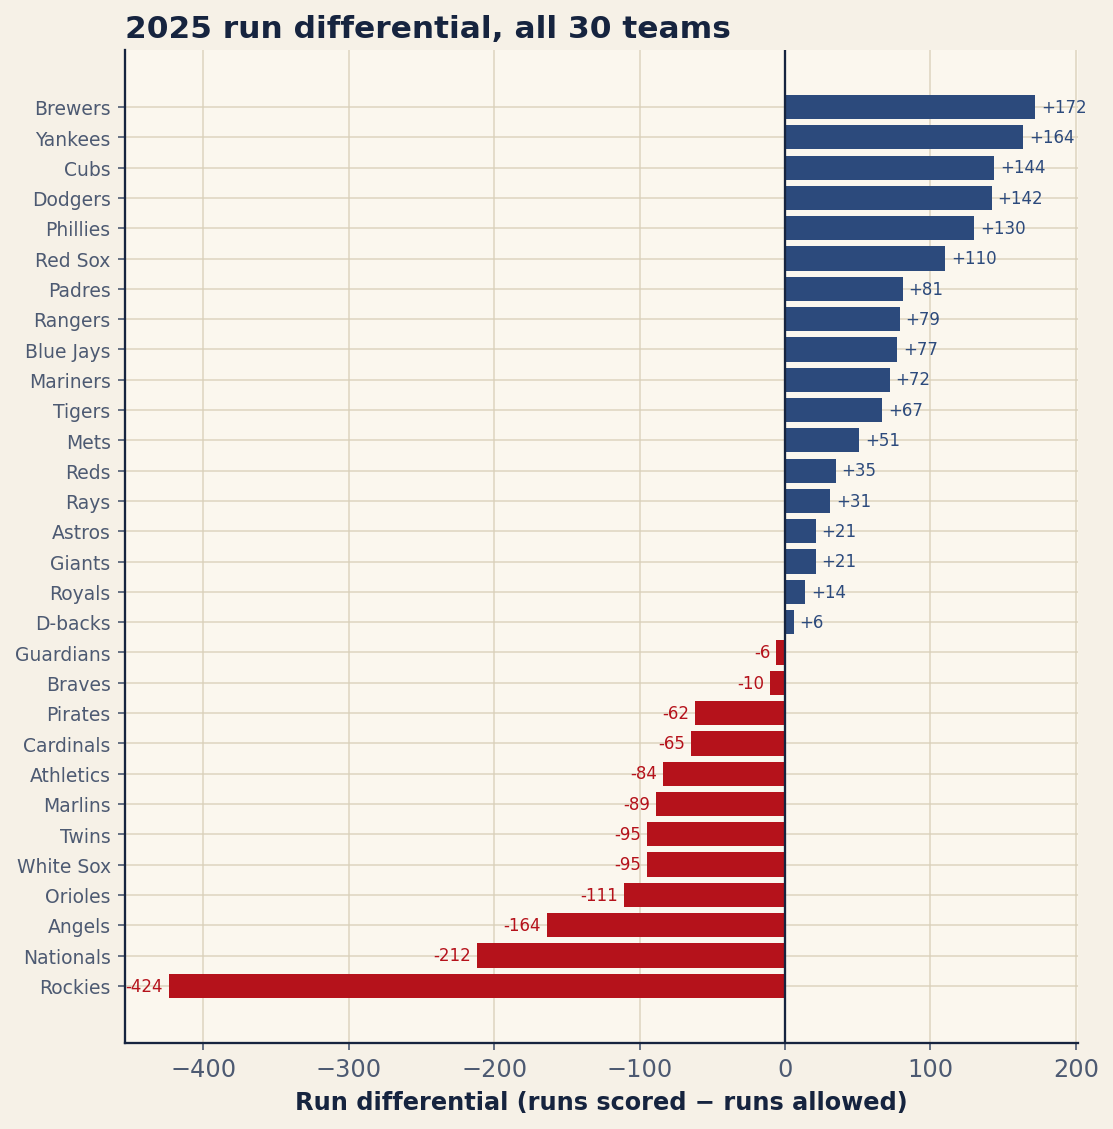
At the top sits Milwaukee at +172 — 806 runs scored against 634 allowed — the best mark in baseball. At the very bottom, in a category of their own, the Colorado Rockies posted a run differential of −424, scoring just 597 while surrendering a barely-believable 1,021. That is not a typo and it is not a rounding error; it is what a 43−119 season looks like in run form.
Step 1: get runs scored and runs allowed
Open a blank spreadsheet and make six columns: Team, W, L, RS (runs scored), RA (runs allowed), and we’ll add more in a moment. Final season totals for every team are a single lookup away — the standings page on any of the major sites lists runs for and against, or you can pull them straight from the MLB Stats API the way the companion script does.
Type the thirty teams in. Put Milwaukee in row 2 with 806 in the RS column and 634 in RA. Put Colorado near the bottom with 597 and 1,021. Everything else in this tutorial is arithmetic on those two columns.
Step 2: compute run differential
This is the easy one. In a new column — call it Run Diff — subtract runs allowed from runs scored. If RS is column D and RA is column E, the cell for row 2 is:
=D2-E2Drag it down all thirty rows. Now sort the sheet by that column, largest to smallest, and you already have a defensible power ranking. Milwaukee’s +172 floats to the top; Colorado’s −424 sinks to the floor. For a lot of purposes you could stop right here. But run differential gets far more interesting when you translate it into the currency everyone actually argues about: wins.
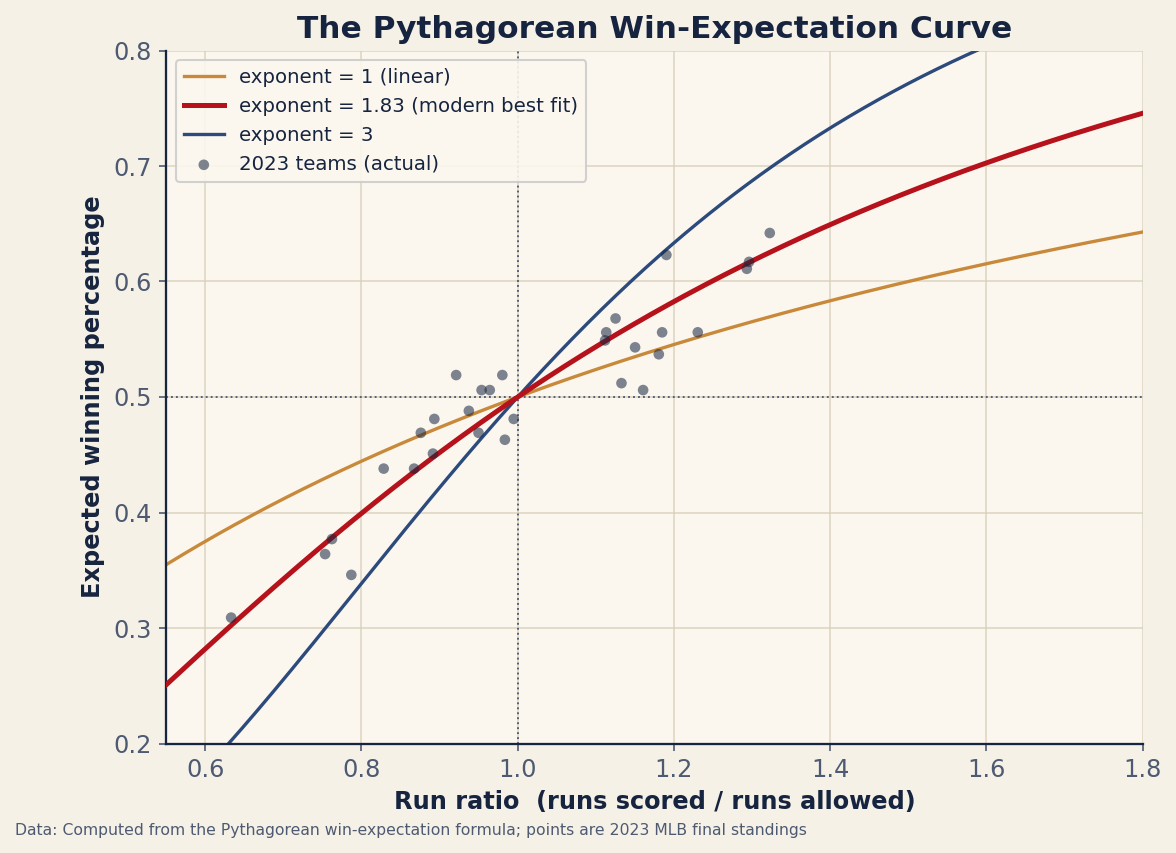
Step 3: the Pythagorean formula
Bill James noticed that the ratio of runs scored to runs allowed predicts winning percentage in a shape that looks like the Pythagorean theorem — hence the name. The modern, better-fitting version of his formula raises each run total to the 1.83 power:
Multiply that percentage by games played and you get expected wins:
The exponent of 1.83 isn’t magic; it’s the value that, fit against decades of real seasons, minimizes the error. James’s original used a round 2, and you’ll still see “Pythagorean” written with a squared exponent, but 1.83 is the sharper modern estimate and the one the companion script uses.
Step 4: type it into the spreadsheet
Suppose runs scored is in column R and runs allowed in column S. The expected winning percentage for row 2 is a literal transcription of the formula — the caret ^ means “raised to the power of”:
=R2^1.83/(R2^1.83+S2^1.83)For expected wins, multiply that by the games the team played. If wins are in column B and losses in column C:
=(R2^1.83/(R2^1.83+S2^1.83))*(B2+C2)Run the Brewers’ line through it — 806 and 634 — and you get an expected winning percentage of about .608, which over their 162 games is roughly 98.5 expected wins. They actually won 97, so the formula had them essentially pegged. Colorado’s 597-and-1,021 line yields about 44.1 expected wins against 43 actual — the Rockies were exactly as bad as they looked.
You don’t have to open a spreadsheet to try it. Drop a few teams into the live builder below — it runs the exact same Pythagorean math and ranks them instantly, with a bar chart of expected wins:
Interactive tool
Power Ranking Builder
Enter several teams' runs scored and allowed; get a live ranked table by Pythagorean wins and run differential, with a bar chart. This interactive calculator needs JavaScript; the formula and explanation above work without it.
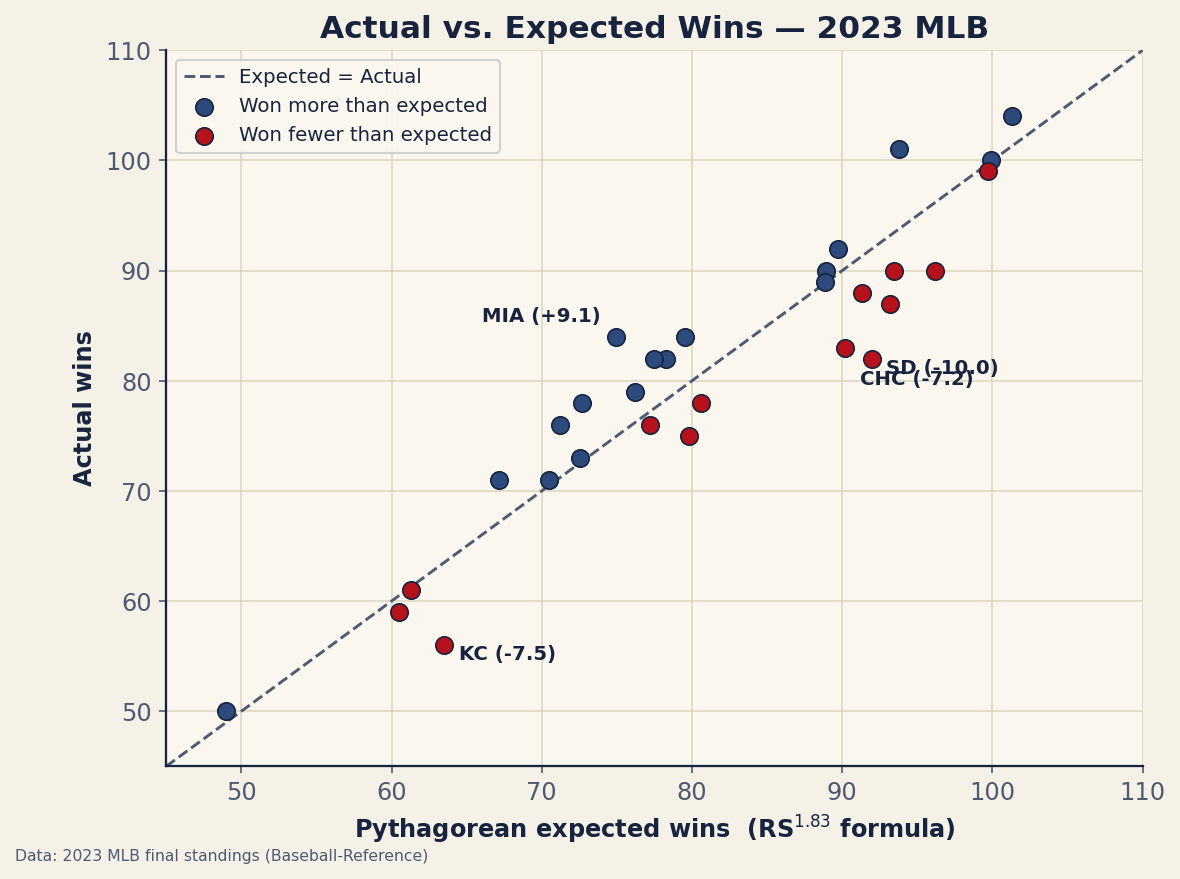
Step 5: measure luck
Now the payoff column. “Luck” is simply actual wins minus expected wins — how many games a team won beyond (or below) what its run differential said it should:
=B2-(R2^1.83/(R2^1.83+S2^1.83))*(B2+C2)Sort by this column and the outliers jump out. In 2025 the luckiest team in baseball was the Cleveland Guardians: their run differential of just −6 implied about 80.3 wins, yet they actually won 88 — nearly eight wins of good fortune, the kind of timing in close games that rarely survives into the next season. At the other extreme, the unluckiest team was the Chicago White Sox, who “should” have won about 70.9 games on their run totals but managed only 60 — almost eleven wins worse than their differential deserved.
This is the column that earns its keep. A team carrying a fat positive luck number is a regression candidate; a good team with a deeply negative one is often a buy-low bounce-back. The full ranking, expected wins and luck included for all thirty teams, is below.
| Team | W | L | RS | RA | Run Diff | Pyth W | Luck |
|---|---|---|---|---|---|---|---|
| Brewers | 97 | 65 | 806 | 634 | 172 | 98.5 | -1.5 |
| Yankees | 94 | 68 | 849 | 685 | 164 | 96.7 | -2.7 |
| Cubs | 92 | 70 | 793 | 649 | 144 | 95.7 | -3.7 |
| Dodgers | 93 | 69 | 825 | 683 | 142 | 94.9 | -1.9 |
| Phillies | 96 | 66 | 778 | 648 | 130 | 94.4 | 1.6 |
| Red Sox | 89 | 73 | 786 | 676 | 110 | 92.1 | -3.1 |
| Padres | 90 | 72 | 702 | 621 | 81 | 90.0 | -0.0 |
| Rangers | 81 | 81 | 684 | 605 | 79 | 90.1 | -9.1 |
| Blue Jays | 94 | 68 | 798 | 721 | 77 | 88.5 | 5.5 |
| Mariners | 90 | 72 | 766 | 694 | 72 | 88.3 | 1.7 |
| Tigers | 87 | 75 | 758 | 691 | 67 | 87.8 | -0.8 |
| Mets | 83 | 79 | 766 | 715 | 51 | 86.1 | -3.1 |
| Reds | 83 | 79 | 716 | 681 | 35 | 84.7 | -1.7 |
| Rays | 77 | 85 | 714 | 683 | 31 | 84.3 | -7.3 |
| Astros | 87 | 75 | 686 | 665 | 21 | 83.3 | 3.7 |
| Giants | 81 | 81 | 705 | 684 | 21 | 83.2 | -2.2 |
| Royals | 82 | 80 | 651 | 637 | 14 | 82.6 | -0.6 |
| D-backs | 80 | 82 | 791 | 785 | 6 | 81.6 | -1.6 |
| Guardians | 88 | 74 | 643 | 649 | -6 | 80.3 | 7.7 |
| Braves | 76 | 86 | 724 | 734 | -10 | 80.0 | -4.0 |
| Pirates | 71 | 91 | 583 | 645 | -62 | 73.5 | -2.5 |
| Cardinals | 78 | 84 | 689 | 754 | -65 | 74.3 | 3.7 |
| Athletics | 76 | 86 | 733 | 817 | -84 | 73.0 | 3.0 |
| Marlins | 79 | 83 | 709 | 798 | -89 | 72.3 | 6.7 |
| Twins | 70 | 92 | 678 | 773 | -95 | 71.3 | -1.3 |
| White Sox | 60 | 102 | 647 | 742 | -95 | 70.9 | -10.9 |
| Orioles | 75 | 87 | 677 | 788 | -111 | 69.8 | 5.2 |
| Angels | 72 | 90 | 673 | 837 | -164 | 65.0 | 7.0 |
| Nationals | 66 | 96 | 687 | 899 | -212 | 61.5 | 4.5 |
| Rockies | 43 | 119 | 597 | 1021 | -424 | 44.1 | -1.1 |
Run differential is the team’s “deserved” record — and over time, deserved wins out.
Reading your finished sheet
A few patterns are worth pointing out once the numbers are in. Notice how the genuinely elite teams — the Brewers, Yankees (+164), Dodgers (+142) — cluster at the top of run differential and near zero on luck; great teams usually earn it honestly. The drama lives in the disagreements: a club whose actual record sits far above its expected wins is the one to be skeptical of in October, and the one whose record undersells its run differential is the sleeper.
The same Pythagorean math scales down to a single month or up across a franchise’s history, and it’s the conceptual seed of more elaborate forecasting systems. If you’d rather automate the data pull instead of typing standings by hand, our guide to getting started with pybaseball shows how to fetch runs scored and allowed in a couple of lines.
The bottom line
A power ranking doesn’t require a model or a subscription — it requires two columns of runs and a formula you can type in under a minute. Run differential tells you who has actually outscored their opponents; the Pythagorean conversion tells you what record that earns; and the luck column tells you who is about to give some of it back. In 2025 that meant respecting the Brewers’ +172, pitying the Rockies’ −424, and quietly betting against the Guardians’ good timing. Build the sheet once, and you’ll never read a standings page the same way again.
Sources & Further Reading
- Chapter 22: Correlation and Simple Linear Regression covers the foundations; it’s free to read at DataField.dev.
- 2025 standings, run differential, and Pythagorean expectation re-runnable via
scripts/run_differential_ranking.py(data from the MLB Stats API, retrieved June 2026). - SABR — background on Bill James’s Pythagorean expectation and its refinements.
- Baseball-Reference — standings and the “Pythagorean W-L” column for every season.