There is a sentence in old baseball coverage that reads, today, like a dispatch from another planet: the starting pitcher finished what he started. Not occasionally, not as a heroic exception — routinely, as the default. In 1904 a starting pitcher who left before the final out was the unusual case. In 2025 the opposite is true to a degree that borders on absolute. The complete game has not declined. It has gone effectively extinct.
This is one of the most dramatic single-stat collapses in the sport’s history, and unlike the strikeout’s long climb, it has the clean shape of something falling off a cliff. It is also the exact mirror image of another story — the rise of the bullpen — because every out a starter no longer records is an out somebody in relief now does.
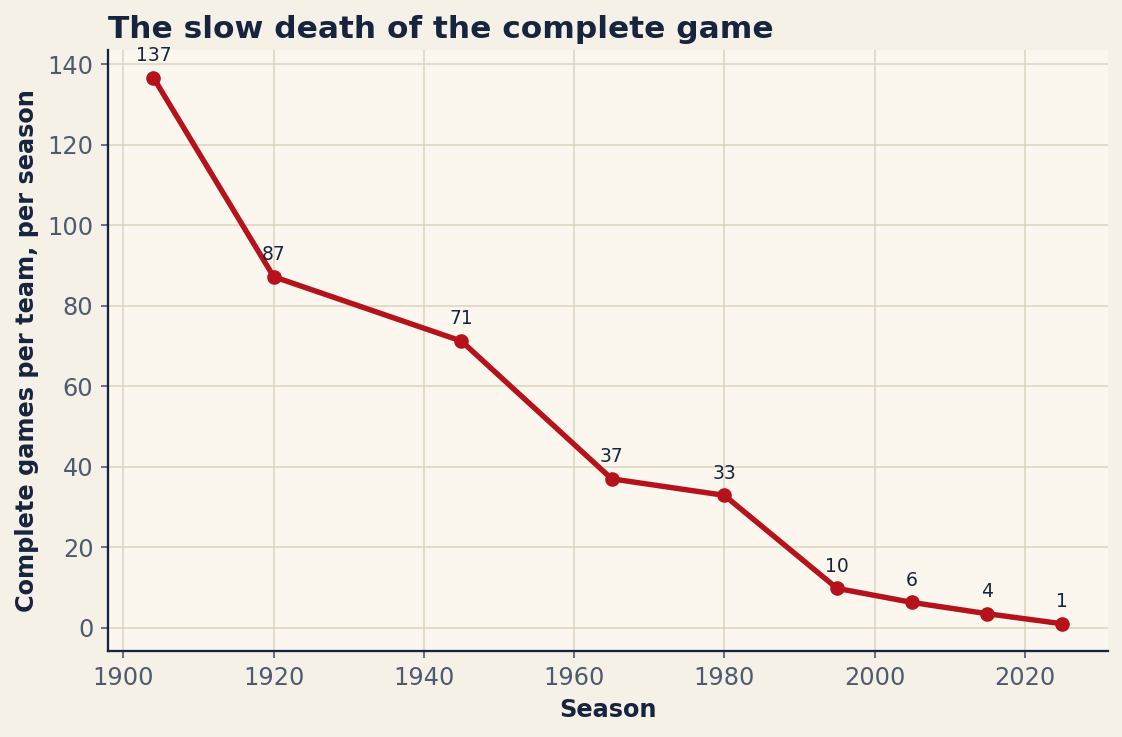
A number that fell off a cliff
The headline figures are almost hard to believe sitting next to each other. In 1904, the average team completed 136.6 games — that is per team, in a single season — and those complete games accounted for 87.6% of all starts. In 2025 the average team completed 1.0 game across the entire year, a rounding error representing barely 0.6% of starts. The leaguewide total in 2025 was just 29 complete games among all thirty clubs combined.
Read that again. A typical 1904 staff finished more games by itself than the entire major leagues finished in 2025. The figure below plots the descent, and there is no real ambiguity about the trajectory — it is a slide that starts steep and ends flat against the floor.
The slow first act, 1904–1945
The decline began early but politely. By 1920, complete games per team had already fallen to 87.2, and the share of starts finished had dropped from nearly nine-in-ten to 56.5%. The live-ball era made innings more taxing — more baserunners, more big swings, more pitches per out — and managers began, tentatively, to pull tiring starters. By 1945 the per-team figure was 71.2 and the completion rate 46.3%: still a world in which a starter finishing his game was a coin flip rather than a surprise, but a clear erosion from the dead-ball norm.
Even at this stage, though, the complete game was structurally central to how teams were built. Relief pitching existed, but it was a job for swingmen and fading veterans, not a specialized art. The starter was expected to be the plan from the first pitch to the last.
The bullpen learns its trade, 1965–1980
The middle decades are where the idea of the modern bullpen took root, and the numbers register it immediately. By 1965, complete games per team had fallen to 37.0 — barely a quarter of the 1904 figure — and to 22.8% of starts. The save became an official statistic in 1969, and with it came the notion of a dedicated late-inning man whose entire role was to finish what the starter could not. The closer was born as a job title, and every closer who recorded a final out was, by definition, a complete game that did not happen.
The 1980 figures held roughly steady at 32.9 per team and 20.3% of starts, a brief plateau before the real collapse. Teams now carried relievers as specialists, but the one-inning-closer orthodoxy and the deep, layered bullpen were still a decade away. A workhorse ace could still be expected to go the distance a couple dozen times a year.
Why the starter stopped finishing
What happened next was not one decision but a stack of them, each individually rational and collectively fatal to the complete game. Start with the times-through-the-order penalty — the well-documented fact that hitters perform meaningfully better the third and fourth time they see a starter in a game. Once front offices quantified that penalty, the logic of letting a tiring starter face a lineup a third time, when a fresh reliever throwing harder was sitting in the bullpen, simply evaporated. The numbers said to make the change, and teams made it.
Layer on pitch counts and injury caution. The 100-pitch limit hardened from guideline into near-religion as organizations grew protective of expensive, fragile arms; a starter cruising in the seventh at 95 pitches now gets removed on principle, not performance. Add the five-man rotation, which traded the four-man workhorse staffs of the past for more arms throwing fewer innings each, and the structural incentive to stretch any single starter disappeared. And add relief specialization — the seventh-inning setup man, the eighth-inning bridge, the matchup lefty — which gave managers a deep menu of fresh, high-velocity options for exactly the innings a starter used to own.
The combined effect was brutal and fast. By 1995, complete games per team had crashed to 9.8 — below double digits for the first time, at 6.8% of starts. By 2005 it was 6.3 per team; by 2015, 3.5. The complete game had gone from the default to a stunt.
“The ace threw eight” becomes a headline
The cultural marker of how far this has gone is that finishing a game is now genuinely newsworthy. A generation ago, an ace tossing a nine-inning shutout was a good night at the office. Today, “the ace threw eight” — not even nine, just eight — is treated as a noteworthy display of old-school durability, and a true complete game gets written up as an event. When the 2025 leaguewide total is 29, every single one of them is, almost by definition, a story.
This is the precise inverse of the bullpen’s ascent. The outs have not vanished from baseball; they have migrated. The whole arc of where those innings went — the multi-inning relievers, the bullpen games, the openers — is the subject we unpack in our look at modern bullpen usage patterns. Read the two stories together and they snap into focus as a single transfer of labor: from one durable arm to a committee of fresh ones.
The decline, decade by decade
The intermediate seasons tell the story better than any summary, because the steadiness of the fall is the whole point — this was not one bad year but a hundred-year glide path to extinction.
| Season | CG / team | CG % of starts | CG total |
|---|---|---|---|
| 1904 | 136.6 | 87.6 | 2186 |
| 1920 | 87.2 | 56.5 | 1395 |
| 1945 | 71.2 | 46.3 | 1140 |
| 1965 | 37.0 | 22.8 | 739 |
| 1980 | 32.9 | 20.3 | 856 |
| 1995 | 9.8 | 6.8 | 275 |
| 2005 | 6.3 | 3.9 | 189 |
| 2015 | 3.5 | 2.1 | 104 |
| 2025 | 1.0 | 0.6 | 29 |
The bottom line
From 136.6 complete games per team in 1904 to 1.0 in 2025, the most basic expectation of a starting pitcher — that he would finish the game he started — has been dismantled piece by piece by the times-through-the-order penalty, the pitch count, the five-man rotation, and a bullpen that grew from afterthought into the central engine of run prevention. The complete game is not coming back; the incentives that killed it are stronger than ever. What used to be the job is now the exception, and the exception barely happens at all.
Sources & Further Reading
- For the fundamentals, see Chapter 11: Working with Dates, Times, and Time Series Data in DataField.dev’s free textbook library.
- Historical complete-game data: MLB.com (MLB Stats API, league AL/NL pitching). Numbers retrieved June 2026; re-runnable via
scripts/complete_games.py. - Baseball-Reference — season-by-season complete-game totals and starts.
- FanGraphs — research on the times-through-the-order penalty and relief usage.