The 2023 Miami Marlins were outscored. Over a full 162 games they pushed across 666 runs and surrendered 723 — a run differential of −57, the profile of a 75-win also-ran. They won 84 games and went to the playoffs. The San Diego Padres did the opposite: they outscored their opponents by 104 runs, a mark that screams 92 wins and a division race, and they finished 82−80 and stayed home in October. Same sport, same season, and yet the scoreboard and the standings told two completely different stories about each club.
That gap — between the record a team earned in runs and the record it actually banked in wins — is the single cleanest measure of season-long luck we have. I ran it for all thirty 2023 teams using the Pythagorean win expectation, and the answer is unambiguous: the luckiest team in baseball was Miami, and the unluckiest, by a wide margin, was San Diego. Here is how I got there, and why I trust the finding more than the standings.
The one number that sees through a record
A team’s win-loss record is a true fact and a misleading one at the same time. It’s true because those games happened; it’s misleading because it tells you nothing about how the runs were distributed across games. Score your runs in tidy, evenly-spaced helpings and lose a bunch of one-run games, and your record will understate you. Bunch your runs into a few laughers and win the close ones, and your record flatters you. The runs are the same either way. Only the timing differs, and timing — over a single season — is mostly noise.
Bill James gave us the tool to quantify this back in the early Baseball Abstracts. He noticed that the ratio of runs scored to runs allowed predicts winning percentage in a shape that echoes the Pythagorean theorem, which is where the name comes from. The modern, better-fitting version raises each run total to the 1.83 power:
Multiply that by games played and you get a team’s expected wins — the record its run differential earned. Subtract that from its actual wins and you get the residual I’m calling luck:
A big positive residual means a team won more games than its runs deserved; a big negative one means it won fewer. That residual is the whole article.
The luckiest and unluckiest teams of 2023
When you compute that residual for every team and rank it, the 2023 season fans out into a clean distribution. Most clubs cluster near zero — their records honestly reflected their runs — and a handful at each tail did something the run differential never sanctioned. Here is the full ranking, luckiest at the top:
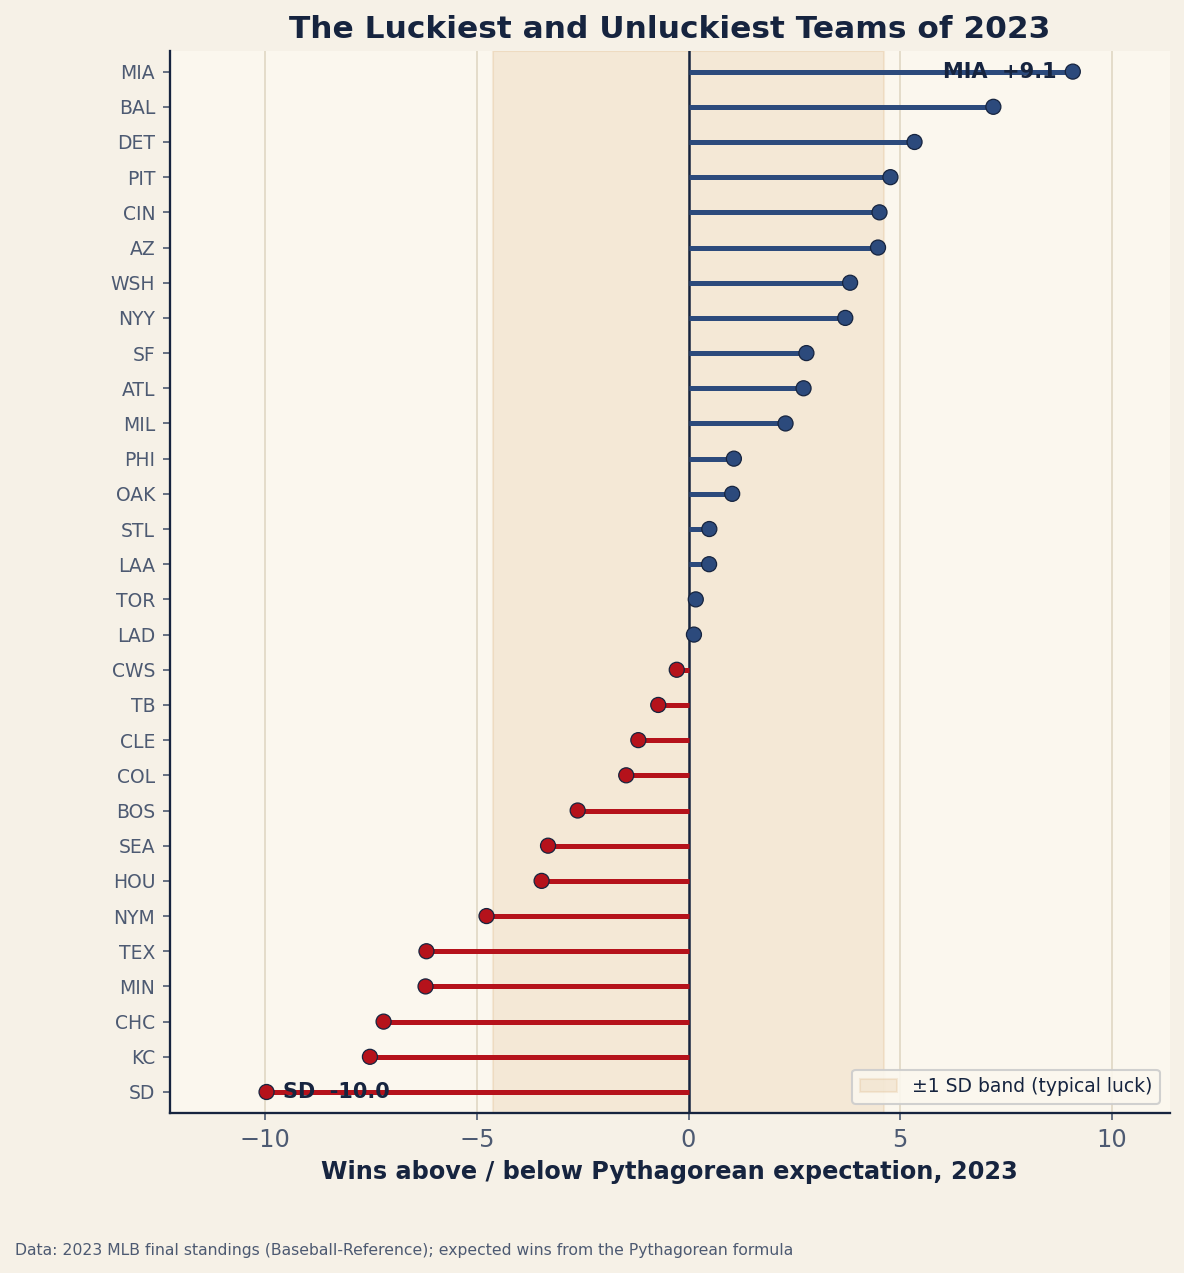
The two extremes are the headline. Miami won about nine more games than its run differential called for; San Diego won ten fewer. Behind them, the Baltimore Orioles (+7.2) turned a very good run differential into a 101-win juggernaut, while the Texas Rangers (−6.2) underperformed a +165 differential — and then, in a final cosmic joke on the model, went and won the World Series anyway. The full table, with each team’s runs, differential, expected wins, and luck, is below.
| Team | W | RS | RA | Run Diff | Pyth W | Luck |
|---|---|---|---|---|---|---|
| Marlins | 84 | 666 | 723 | -57 | 74.9 | 9.1 |
| Orioles | 101 | 807 | 678 | 129 | 93.8 | 7.2 |
| Tigers | 78 | 661 | 740 | -79 | 72.7 | 5.3 |
| Pirates | 76 | 692 | 790 | -98 | 71.2 | 4.8 |
| Reds | 82 | 783 | 821 | -38 | 77.5 | 4.5 |
| D-backs | 84 | 746 | 761 | -15 | 79.5 | 4.5 |
| Nationals | 71 | 700 | 845 | -145 | 67.2 | 3.8 |
| Yankees | 82 | 673 | 698 | -25 | 78.3 | 3.7 |
| Giants | 79 | 674 | 719 | -45 | 76.2 | 2.8 |
| Braves | 104 | 947 | 716 | 231 | 101.3 | 2.7 |
| Brewers | 92 | 728 | 647 | 81 | 89.7 | 2.3 |
| Phillies | 90 | 796 | 715 | 81 | 88.9 | 1.1 |
| Athletics | 50 | 585 | 924 | -339 | 49.0 | 1.0 |
| Cardinals | 71 | 719 | 829 | -110 | 70.5 | 0.5 |
| Angels | 73 | 739 | 829 | -90 | 72.5 | 0.5 |
| Blue Jays | 89 | 746 | 671 | 75 | 88.8 | 0.2 |
| Dodgers | 100 | 906 | 699 | 207 | 99.9 | 0.1 |
| White Sox | 61 | 641 | 841 | -200 | 61.3 | -0.3 |
| Rays | 99 | 860 | 665 | 195 | 99.7 | -0.7 |
| Guardians | 76 | 662 | 697 | -35 | 77.2 | -1.2 |
| Rockies | 59 | 721 | 957 | -236 | 60.5 | -1.5 |
| Red Sox | 78 | 772 | 776 | -4 | 80.6 | -2.6 |
| Mariners | 88 | 758 | 659 | 99 | 91.3 | -3.3 |
| Astros | 90 | 827 | 698 | 129 | 93.5 | -3.5 |
| Mets | 75 | 717 | 729 | -12 | 79.8 | -4.8 |
| Rangers | 90 | 881 | 716 | 165 | 96.2 | -6.2 |
| Twins | 87 | 778 | 659 | 119 | 93.2 | -6.2 |
| Cubs | 83 | 819 | 723 | 96 | 90.2 | -7.2 |
| Royals | 56 | 676 | 859 | -183 | 63.5 | -7.5 |
| Padres | 82 | 752 | 648 | 104 | 92.0 | -10.0 |
A worked example: pricing the Padres’ bad luck by hand
I don’t want you to take the −10.0 on faith, so let’s build it from the two raw numbers. San Diego scored 752 runs and allowed 648 in 2023. Drop those into the formula. First raise each to the 1.83 power:
752 ^ 1.83 = 183,433
648 ^ 1.83 = 139,695
Now the expected winning percentage is just the first over the sum of both:
183,433 / (183,433 + 139,695) = 0.5677A .568 team over 162 games “should” win 0.5677 × 162 = 92.0 games. The Padres won 82. That is the −10.0 residual, computed end to end from nothing but their runs scored and allowed. A .568 expected winning percentage is a legitimate division contender; an 82−80 finish is a vacation. Ten wins is an enormous gap — the difference between a wild-card berth and a long winter — and San Diego left every one of them on the table by losing close games it had the run profile to win.
Run the same arithmetic on Miami’s 666 and 723 and you get an expected winning percentage of .462, or 74.9 expected wins against 84 actual — the +9.1 that made the Marlins the luckiest team in the sport. Want to test your own club? Drop a team’s runs scored and allowed into the calculator and it runs this exact math:
Interactive tool
Pythagorean Win Expectation
Expected winning percentage and a projected W–L record from runs scored and runs allowed. This interactive calculator needs JavaScript; the formula and explanation above work without it.
What the residual actually measures — and what it doesn’t
Here is where I have to be honest about the limits, because this is the part most “luck” takeaways skip. The Pythagorean residual is not a pure measurement of luck. It is the leftover after a deliberately simple model, and that leftover is a mix of three things.
The first is genuine timing noise — the part that really is luck. A team that happens to win a cluster of one-run games isn’t doing something repeatable, and that’s why the residual is the single best regression flag we have. But the second ingredient is unmodeled skill the formula ignores by design. Pythagoras only sees total runs for and against. It has no idea whether a team has a lights-out bullpen that locks down close games, a manager who deploys his relievers well, or a roster built to sequence hits in high-leverage spots. A good late-game bullpen will systematically beat its Pythagorean record, year after year, and that’s not luck — it’s a real edge the model can’t see. The third ingredient is plain noise in the inputs: a couple of 15−2 blowouts inflate a team’s runs scored without buying it a single extra win, dragging its expected wins up and its residual down for reasons that have nothing to do with how good it is.
So when I say the Padres were “unlucky,” I mean it with an asterisk: most of that −10 was probably timing they’ll never get back, but some slice of it was a bullpen and a clutch profile that genuinely cost them in tight games. The honest framing is that a large residual is a signal worth investigating, not a verdict. And one season is a small sample — thirty teams, one year. The residual’s standard deviation across 2023 was about 4.6 wins, and twenty of the thirty teams fell within one of those of zero. The tails are dramatic; the middle is quiet, and that’s exactly what you’d expect if most of this is noise.
Why this matters going forward
The reason a front office cares about this column isn’t bragging rights about who got robbed. It’s prediction. The piece of the residual that’s timing luck doesn’t persist — it regresses to the mean, often within the same season. That makes a team carrying a fat positive residual a sell-high regression candidate, and a good team buried under a deeply negative one a buy-low bounce-back bet. It’s the same logic that makes run differential a better predictor of next year’s record than this year’s record, which is the whole premise behind building a run-differential power ranking in the first place.
There’s also a deeper layer underneath the runs themselves. Pythagoras treats runs scored as a given, but a lineup’s run total is itself partly a matter of sequencing luck — whether its hits clustered into rallies or scattered into solo singles. If you want to chase the luck one level further down, BaseRuns and cluster luck estimate the runs a team “should” have scored from its raw events, before timing got involved. Stack BaseRuns under Pythagoras and you can separate cluster luck in the offense from timing luck in the win column — two different dice rolls that both get folded into a single misleading record.
The 2023 Marlins and Padres are the cleanest case study you could ask for. One team turned a losing run differential into a playoff berth; the other turned a contender’s run differential into a non-event. The standings remembered only the outcome. The math remembers the process — and the process is what tends to repeat.
Reproduce it yourself
Every number here comes from one CSV of 2023 final standings and one formula. The expected-wins column is G × RS^1.83 / (RS^1.83 + RA^1.83); the luck column is actual W − expected W. The residual chart and ranked table are regenerated by charts/chart_pythag_residuals.py against the bundled standings — no network, no hand-entered values, nothing invented. Change the exponent, swap in another season’s standings, and the same script will name that year’s luckiest and unluckiest clubs.
Sources & Further Reading
- 2023 final standings, runs scored/allowed, and the Pythagorean residual: bundled
data_layer/standings_2023.csv, charted bycharts/chart_pythag_residuals.py(data from Baseball-Reference). - Bill James — the original Pythagorean win expectation, introduced in the Baseball Abstract; background and the refined 1.83 / Pythagenpat exponent via SABR.
- Baseball-Reference — the “Pythagorean W-L” column published for every team and season.