Open three different websites in September and you’ll find three different playoff probabilities for the same team. One says 61%, another 54%, a third 67%. They’re all built by smart people using real data, and they still don’t agree. That isn’t a scandal or a sign that someone is wrong — it’s the predictable result of how these numbers are made.
A playoff-odds number is not a measurement. It’s the output of a simulation: a model imagines the rest of the season thousands of times and reports how often a given team comes out the other side in the postseason. To show exactly where the disagreements come from, we built a deliberately transparent version — and want to be unambiguous up front that what follows is a labeled teaching simulation, not a claimed forecast of any real team’s chances.
How playoff odds are actually computed
Strip away the branding and every playoff-odds system does the same three things. First, it estimates each team’s “true talent” — some best guess at how good the club really is, expressed as a per-game probability of winning. Second, it plays out every remaining game many thousands of times, letting a coin weighted by that talent decide each one. Third, it counts: in what fraction of those simulated universes did the team reach the playoffs? That fraction is the published number.
The machinery is Monte Carlo simulation, and the logic is pure brute force. You cannot know how the season will end, so you let a computer live through it tens of thousands of times and tally the outcomes. The elegance is that all the messy uncertainty — who’s hot, who gets hurt, who gets a soft schedule — comes out in the wash of repeated trials. The catch is that the answer is only as good as the talent estimates and assumptions you feed in.
Our simulation, stated plainly
To isolate the most fundamental source of disagreement, we built the simplest honest version of a playoff-odds model. We seeded each team’s true-talent win rate with its real 2025 winning percentage, then simulated 50,000 full 162-game seasons, treating each game as a weighted coin flip — wins drawn from a binomial distribution with the team’s talent held perfectly fixed. As an illustrative cutoff we asked how often each team reached 90 wins, a round number that tends to sit near the playoff line. Again: this is a labeled demonstration. We are not claiming these are anyone’s actual odds; we’re using a controlled toy to show why real models diverge.
What the simulation shows
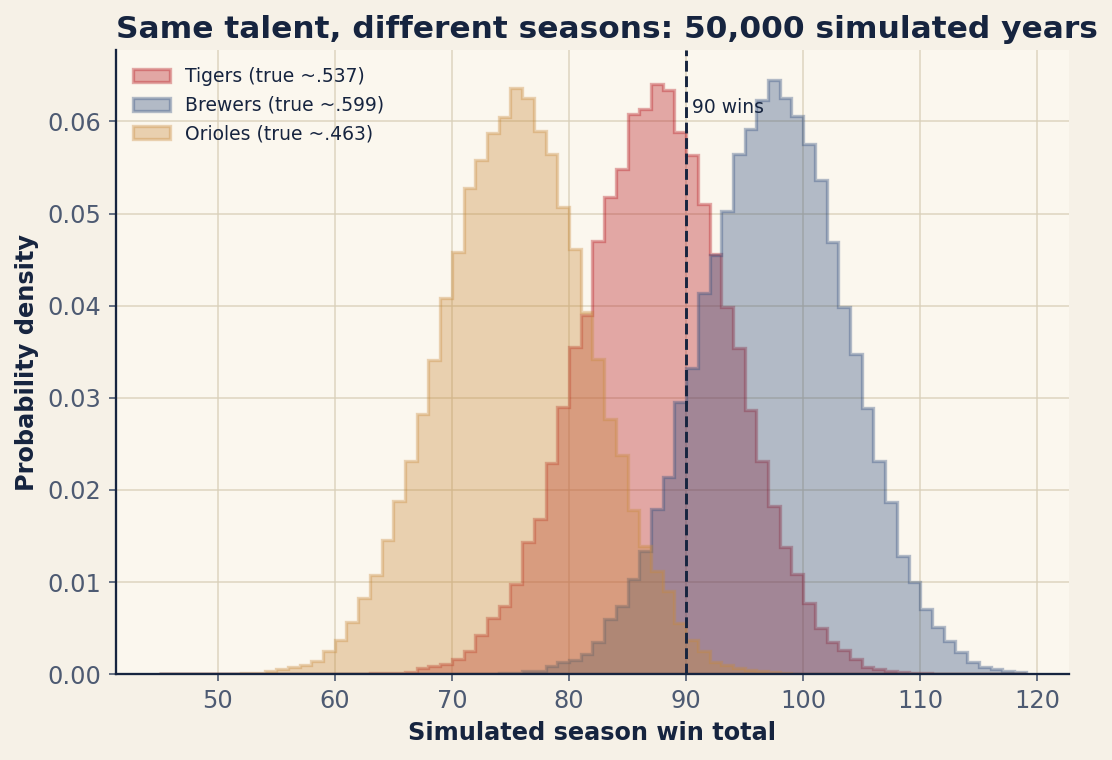
The figure plots the distribution of simulated win totals for three teams chosen to span the standings. A bubble team — the Detroit Tigers, seeded at their .537 2025 win rate — reached 90 wins in 34.6% of the 50,000 simulated seasons. A strong club, the Milwaukee Brewers, got there 88.4% of the time. A sub-.500 team, the Baltimore Orioles, cleared the bar in just 1.1% of seasons. Same simulation, same rules, wildly different odds — driven entirely by the talent each team was seeded with.
Now the number that matters most for this whole discussion. Even with talent held perfectly fixed — no injuries, no trades, no hot streaks, the win rate nailed down to a constant — the simulated win totals still scatter, with a standard deviation of about 6.3 wins. A team that is, by construction, exactly a .537 club will nonetheless finish anywhere across a roughly twenty-game band of outcomes, purely because baseball is a sequence of weighted coin flips. That spread is not a flaw in the model. It is the irreducible noise baked into a 162-game season, and it is the key to everything that follows.
Why reasonable models disagree
With the mechanics on the table, the disagreements between real systems sort into four buckets. The first three are about inputs; the fourth is the one our simulation just demonstrated.
Different talent estimates. This is the largest source of spread. Each system leans on its own projection engine — one might weight a hitter’s recent three seasons differently than another, value defense or baserunning more, or trust a young player’s breakout more readily. Those projections roll up into team talent, and a club one system pegs as a true .540 team another might call .520. In our toy, that exact gap is the difference between a 35% team and something meaningfully lower — a small input change with an outsized effect on the odds.
How they regress and handle change. Small samples lie, so every model pulls extreme early results back toward the mean — but how hard, and how fast, is a judgment call. Systems also differ in how they react to injuries and roster moves: how much to dock a team for a hurt ace, how quickly to credit a deadline acquisition, whether to assume a returning star is fully himself. Two models with identical philosophies can still post different numbers because one updated for a roster change the other hadn’t fully absorbed.
Schedule, park, and bullpen inputs. The remaining schedule isn’t the same difficulty for everyone, and models weight strength-of-schedule differently. Some bake in ballpark effects on run scoring; some model bullpen usage and rest, recognizing that a gassed relief corps wins fewer close games down the stretch. Each of these is a defensible knob, and each one turned a little differently nudges the final percentage.
The irreducible binomial noise. Here is the humbling part our simulation makes concrete. Even if two models somehow agreed perfectly on talent, schedule, and health, the season itself adds roughly six wins of random scatter on top. Because that noise is so large relative to the talent gaps separating contenders — the difference between a good team and a bubble team is often just a handful of expected wins — small differences in talent estimates get amplified into large differences in playoff odds. A model that thinks a team is two wins better than a rival model does isn’t making a rounding error; against a six-win cloud of randomness, those two wins can move the published probability by double digits.
How to read a playoff-odds number
The practical takeaway isn’t cynicism — it’s calibration. A playoff-odds figure is a conditional statement: if this model’s talent estimates are right and if its assumptions about schedule and health hold, here is how often a team like this makes it across many simulated seasons. When two reputable sites disagree, the gap is usually telling you something real about how uncertain the underlying talent is, not that one of them blundered.
So when you see 61% on one site and 54% on another, resist the urge to crown a winner. Read them as a range. The honest interpretation of our own demonstration is that a team can be, by definition, a 34.6% bet to hit 90 wins and still land almost anywhere — and that a strong club at 88.4% is not a lock, just heavily favored across a noisy universe of possible seasons. The percentages are sharp; the future they describe is not.
The bottom line
Playoff odds are simulations wearing the costume of measurements. Each one estimates talent, plays the season out tens of thousands of times, and counts the happy endings — and each one makes its own defensible choices about projections, regression, injuries, schedule, parks, and bullpens. Our labeled demo strips all of that away to expose the floor of the problem: with talent fixed and 50,000 seasons run, win totals still scatter by about 6.3 wins, so a .537 team comes up at 34.6%, a strong team at 88.4%, and a weak one at 1.1%. Against that much built-in randomness, small differences in how a model sees a roster swing the odds hard. The disagreement between two good playoff-odds models isn’t a bug to be resolved. It’s an honest picture of how little even a great forecast can promise about a season that hasn’t been played.
Sources & Further Reading
- Background reading: Chapter 22: Correlation and Simple Linear Regression, a free textbook chapter at DataField.dev.
- Simulation seeds (2025 standings): MLB.com (MLB Stats API, regular-season standings). Retrieved June 2026; the labeled Monte Carlo is re-runnable via
scripts/playoff_odds_sim.py. - FanGraphs — a public playoff-odds system, with documentation of its projection and simulation approach.
- Baseball-Reference — an independent playoff-odds model useful for seeing how two reasonable systems diverge.