Every offseason runs on a quiet assumption: that a team basically is what last year said it was. Contenders reload, losers rebuild, and projections lean hard on the prior record. So here’s a number that should make everyone hold that assumption more loosely. Across four real MLB seasons (2021–2024), a team’s winning percentage in one year correlates with the next at just r = 0.54 — meaning last year explains only about 29% of this year. The other 71% is change: regression to the mean, roster turnover, health, and luck. Baseball remembers less from season to season than the standings make you think.
Pairing up the seasons
The method is simple and uses real, complete standings. Take every team’s winning percentage in 2021, 2022, 2023, and 2024, then form consecutive-season pairs — each team’s 2021 next to its 2022, its 2022 next to its 2023, its 2023 next to its 2024. That’s 90 year-over-year pairs (30 teams × 3 transitions). Plot each team’s “this year” against its “next year” and the strength of the memory falls right out of the cloud.
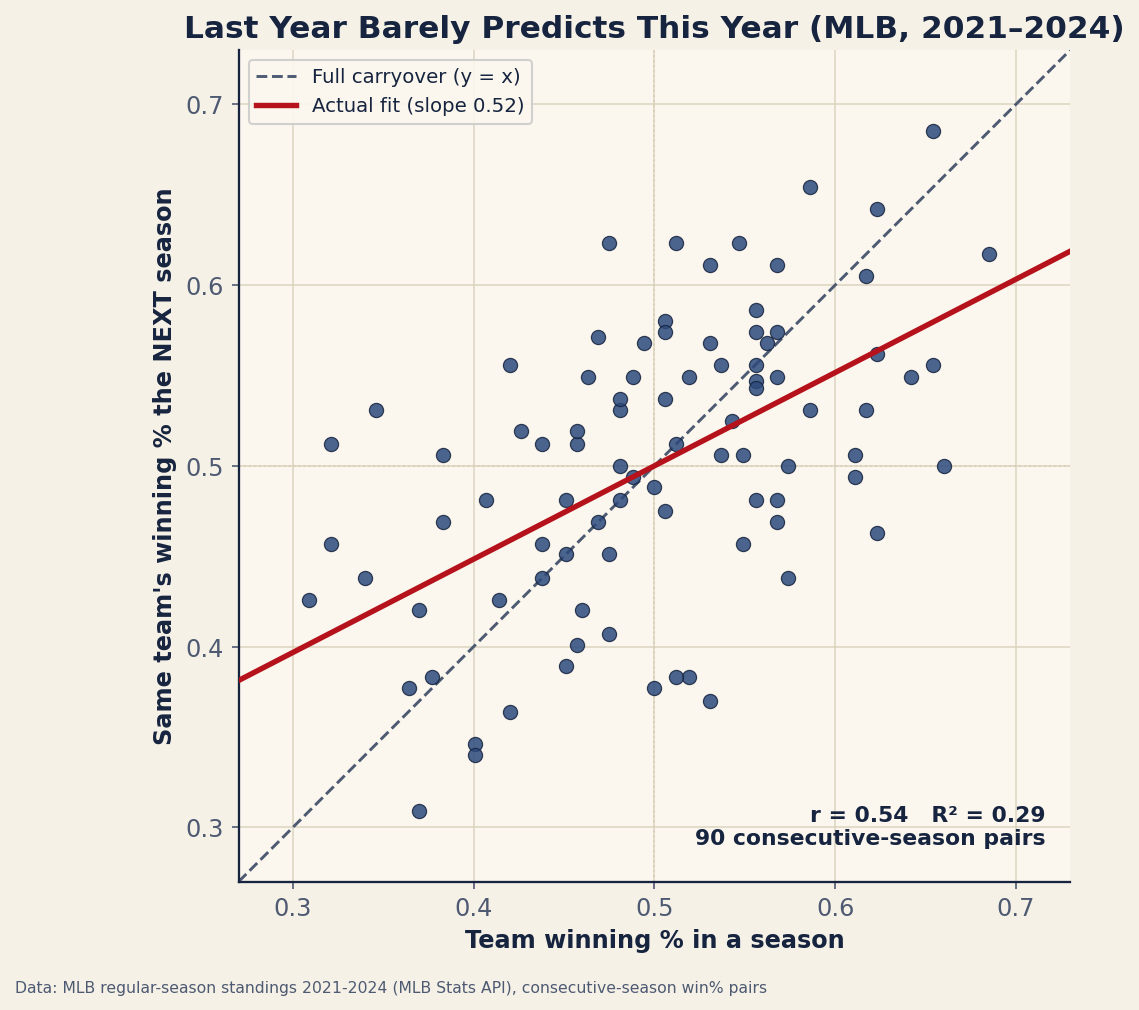
Two features tell the story. The fit line’s slope is about 0.52, not 1.0 — teams move roughly halfway back toward .500 from one season to the next. A 95-win team projects to about 87 the next year on this slope; a 65-win team projects to about 73. And the scatter is enormous: even that flattened line leaves most of the variation unexplained, which is why teams routinely blow past or fall short of it.
The movers prove the point
The 2023-to-2024 transition alone produced swings that no record-based projection would have called:
| Team | 2023 | 2024 | Δ Wins |
|---|---|---|---|
| Royals | 56–106 | 86–76 | +30 |
| Athletics | 50–112 | 69–93 | +19 |
| Guardians | 76–86 | 92–69 | +16 |
| Rays | 99–63 | 80–82 | −19 |
| White Sox | 61–101 | 41–121 | −20 |
| Marlins | 84–78 | 62–100 | −22 |
The Royals jumped 30 wins; the Marlins, a 2023 playoff team, dropped 22; the White Sox fell off the floor to a modern-record 121 losses. These aren’t flukes that break the rule — they are the rule. A 0.54 correlation is precisely a world where most teams drift toward the middle and a handful lurch dramatically every single year.
Why the memory is so short
Several forces pull each season toward independence from the last:
- Regression to the mean. Last year’s record is part skill, part luck. The lucky teams (those who outran their run differential) and the unlucky ones both get pulled back toward their true level, which is closer to .500 than their record was. The 0.52 slope is regression to the mean made visible.
- Roster turnover. Free agency, trades, and prospect promotions reshape a quarter of most rosters every winter. The team that takes the field in April is not the one that finished in October.
- Health and age. A season’s record leans heavily on which stars stayed healthy; injuries don’t carry over predictably, and aging curves quietly erode last year’s cores.
- The schedule resets. Strength of schedule, division quality, and the simple fact of 162 fresh coin-flips all start over.
None of this means last year is worthless — r = 0.54 is a real, useful signal, and good teams do stay good more often than not. It means last year is a starting point that needs heavy regressing, not a forecast.
What a smarter projection does
This is exactly why systems like the ones behind preseason projections never just echo last year’s record. They regress it toward the mean (the 0.52 slope is a crude version of that), then add back what the raw record ignores: the underlying run differential, player-level projections for the actual current roster, age adjustments, and playing-time estimates. The naive “they’ll be about what they were” baseline is the thing those models are built to beat — and a 0.54 correlation is how much room there is to beat it.
Where this read has limits
- Four seasons, 90 pairs. It’s a real but modest sample, and it includes the bounce-back years right after the disruptions of the early 2020s. A longer window might land slightly higher, but multi-decade studies tend to find season-to-season correlations in this same 0.5–0.6 neighborhood.
- Win% hides the cause. Two teams with the same record can be headed opposite directions; one number per season can’t tell a rebuild on the rise from a contender about to crater. That’s the gap player-level projections fill.
- Correlation isn’t a guarantee. The 0.52 slope is an average tendency. Any single team can ignore it entirely — ask the 2024 Royals.
- Roster continuity varies. A team that runs it back intact carries over more than one that tears down; a single leaguewide slope averages over both.
The takeaway
Baseball’s standings have a short memory. From one season to the next, win% carries over at r = 0.54, and teams regress about halfway to .500 — so last year explains under a third of this year, and the rest is change you can’t read off the prior record. The Royals and White Sox aren’t exceptions to that; they’re what a 0.54 correlation looks like in the wild. When the offseason hype insists a team is what it just was, the data’s answer is: probably about halfway.
Reproduce it
The standings are bundled in data_layer/standings_multiseason.json (full regular-season records 2021–2024, pulled from the public MLB Stats API, retrieved 2026-06-20). Pair each team’s consecutive seasons, then compute corr(winpct_year, winpct_next) and fit winpct_next ~ winpct_year by least squares. The scatter and fit are regenerated by charts/chart_year_over_year.py. No network at build time, nothing hand-entered.
Sources & Further Reading
- Free textbook: Chapter 22: Correlation and Simple Linear Regression — the theory behind this, at DataField.dev.
- Regular-season standings 2021–2024: bundled
data_layer/standings_multiseason.json, pulled from the MLB Stats API (retrieved 2026-06-20), charted bycharts/chart_year_over_year.py. - Related: Regression to the mean and how projection systems work — the machinery that turns last year into a real forecast.
- Related: The luckiest and unluckiest teams of 2023 — the luck component that regresses away.