There are two ways to be a good baseball team, and the standings don’t tell them apart. One is the Dodgers: win 95-plus games every single year, metronomic. The other is the modern teardown-and-contend cycle: lose 110, then win 100 two years later. Both can average out to “successful,” but they’re completely different franchises to root for — and you can separate them with one chart. Plot each team’s average winning percentage against the year-to-year volatility of that record, and the league sorts itself into consistent contenders, boom-and-bust rebuilders, and the quietly stuck-in-the-middle.
Two numbers per franchise
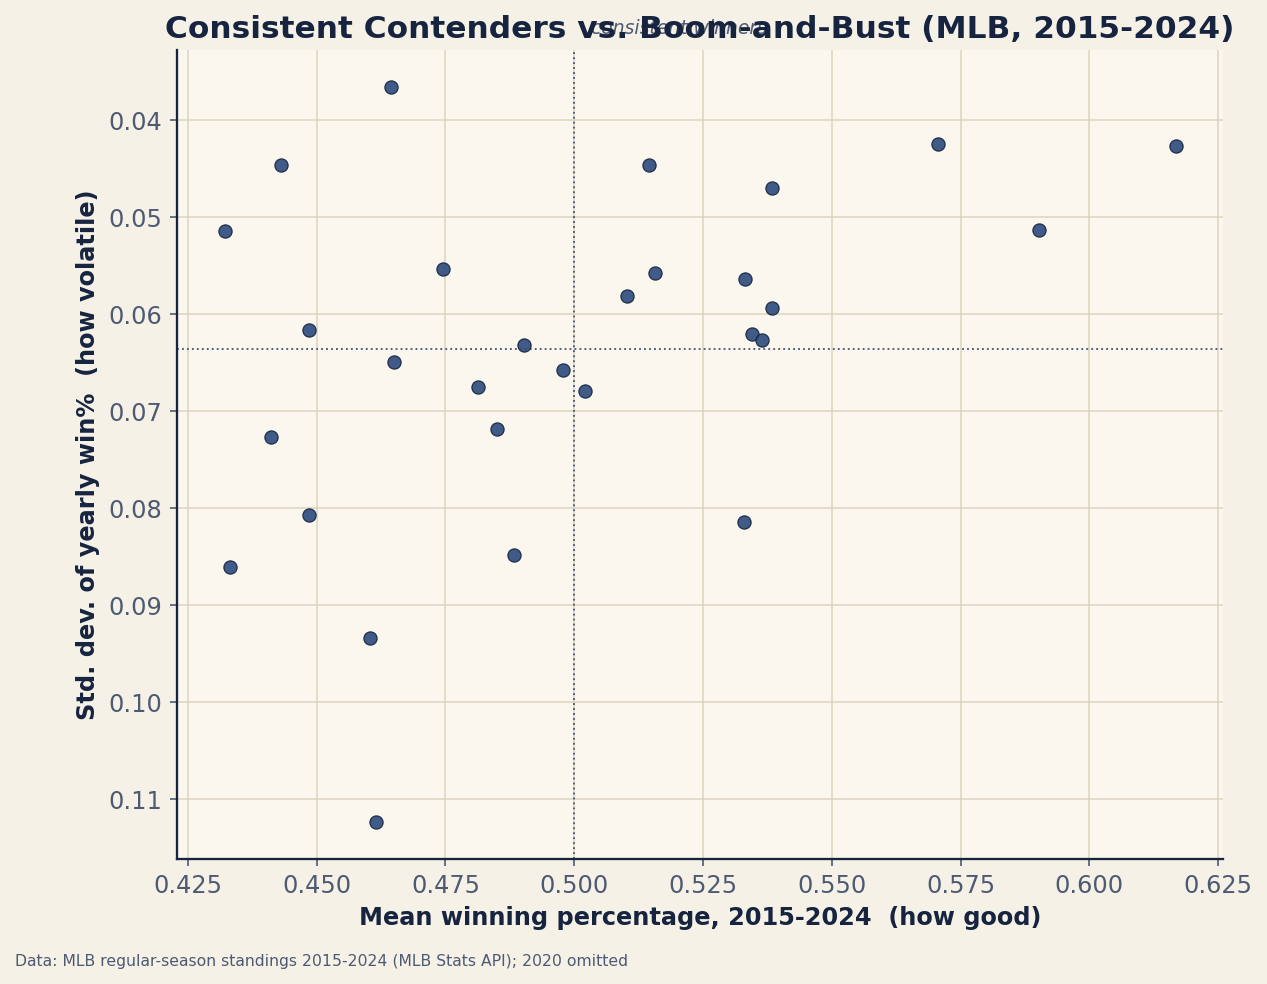
Using full regular-season records from 2015 through 2024 (skipping the 60-game 2020 season, which would distort every average), I computed two things for each franchise: the mean of its nine yearly winning percentages — how good it’s been — and the standard deviation of those nine numbers — how much it bounces around. Mean is the altitude; standard deviation is the turbulence. Together they place every team on a map the raw standings can’t draw.
The exhibit
The map has four meaningful corners:
- Good and steady (the enviable corner): the Dodgers (.617 mean, .043 SD) and Yankees (.571, .042) win a lot and almost never have a down year. This is the hardest profile to achieve and the most valuable.
- Boom-and-bust: the Orioles (.461, .112), Athletics (.460, .093), and White Sox (.433, .086) are the league’s most volatile — deep teardowns punctuated by contention spikes. Same decade-long mean as a stable .500 club, a totally different experience.
- Consistently mediocre: the Angels are the single most consistent team in baseball by this measure (.037 SD) — and they spent the whole span hovering at .464. Steady isn’t the same as good.
| Franchise | Mean win% | SD | Profile |
|---|---|---|---|
| Dodgers | .617 | .043 | Good & steady |
| Astros | .590 | .051 | Good & steady |
| Yankees | .571 | .042 | Good & steady |
| Angels | .464 | .037 | Consistently mediocre |
| White Sox | .433 | .086 | Boom-and-bust |
| Athletics | .460 | .093 | Boom-and-bust |
| Orioles | .461 | .112 | Boom-and-bust |
Why volatility is a choice now
The high-SD cluster isn’t random — it’s strategy. The modern “tank-and-spend” cycle deliberately trades several losing seasons for high draft picks and payroll flexibility, then cashes them in for a contention window. The Orioles are the textbook case: bottoming out in the late 2010s, then surging. That produces a high standard deviation by design. The Dodgers represent the opposite philosophy — sustained payroll and a deep pipeline that refuses to bottom out, buying a low SD at a high price. Neither is wrong; they’re different answers to the same question, and the scatter plot is a portrait of which front offices chose which.
How mean and volatility relate to luck
Part of every team’s year-to-year wobble is real (roster turnover, injuries, the rebuild cycle) and part is the same timing luck that makes a single season’s record an imperfect read on talent. A team can post a high SD partly because it got unlucky one year and lucky the next without its underlying quality changing much. That’s the same engine behind why last year only weakly predicts this year — records regress, and regression shows up as volatility. The franchises with genuinely low SD (Dodgers, Yankees, Angels) are the ones whose true level barely moved, for better or worse.
Where this read has limits
- Nine seasons is a modest sample for an SD. A standard deviation computed from nine numbers is itself noisy; the broad tiers (steady vs volatile) are trustworthy, but small differences in SD between two mid-pack teams aren’t meaningful.
- Mean hides direction. A .500 mean can be a team declining from good to bad, rising from bad to good, or flat — all three look identical on the mean axis. The SD flags movement but not its direction; you’d overlay the time trend to see that.
- Franchise identity isn’t perfectly stable. Front offices, ownership, and even cities change within a ten-year window, so a single point can blend two different regimes.
- Win% isn’t process. As always, record is a noisy summary of underlying quality; a fuller picture would use run differential or projections rather than wins alone.
The takeaway
“Is this a good franchise?” has two answers, and you need both numbers to give them. The Dodgers and Yankees are good and steady — the rarest, most valuable profile. The Orioles and A’s reached similar decade-long means by riding a rollercoaster the Dodgers never boarded. And the Angels are proof that consistency, on its own, is just a smooth road to nowhere. The standings give you one coordinate; the volatility gives you the other — and only together do they tell you what kind of team you’re actually watching.
Reproduce it
The records are bundled in data_layer/standings_2015_2024.json (full regular seasons 2015–2024, 2020 omitted, pulled from the public MLB Stats API). For each franchise, take the mean and the standard deviation of its yearly winning percentages and plot one against the other. The scatter is regenerated by charts/chart_franchise_consistency.py. No network at build time, nothing hand-entered.
Sources & Further Reading
- Free textbook: Chapter 6: Numerical Summaries: Center, Spread, and Shape — the theory behind this, at DataField.dev.
- Regular-season standings 2015–2024: bundled
data_layer/standings_2015_2024.json, pulled from the MLB Stats API (retrieved 2026-06-21), charted bycharts/chart_franchise_consistency.py. - Related: Does last year predict this year? — the season-to-season carryover that volatility measures.
- Related: The luckiest and unluckiest teams of 2023 — the timing luck inside every team’s yearly wobble.