“Which league is better?” sounds like a bar argument with no answer, because you can’t compare the AL and NL through their standings — each league mostly plays itself, so its internal wins and losses cancel out and tell you nothing about the other league. But there’s a clean way through, and it’s hiding in one column of the standings. Here’s the 2023 finding: the National League was the stronger league, outscoring the AL by 44 runs in their head-to-head games — while the single best division in baseball was the AL East, and the single worst was the AL Central, by a mile.
The trick: what cancels, and what doesn’t
Start with a fact that does all the work. Across the whole sport, every run scored by someone is a run allowed by someone else, so the 30 teams’ run differentials sum to exactly zero. Now zoom into one league. Almost all of an AL team’s games are against other AL teams, and within the AL those runs scored and allowed cancel out the same way — one team’s interdivision win is another’s loss. The only games that don’t cancel inside the AL ledger are the ones played against the NL.
So when you add up every AL team’s run differential, the intra-league noise washes out and you’re left with one number: the AL’s net margin in interleague play. It’s a clean, fabrication-proof read on which league won the actual head-to-head season, derived from nothing but the RunDiff column. In 2023 it came out AL −44, NL +44 — the leagues are mirror images because, again, the total has to be zero.
The exhibit
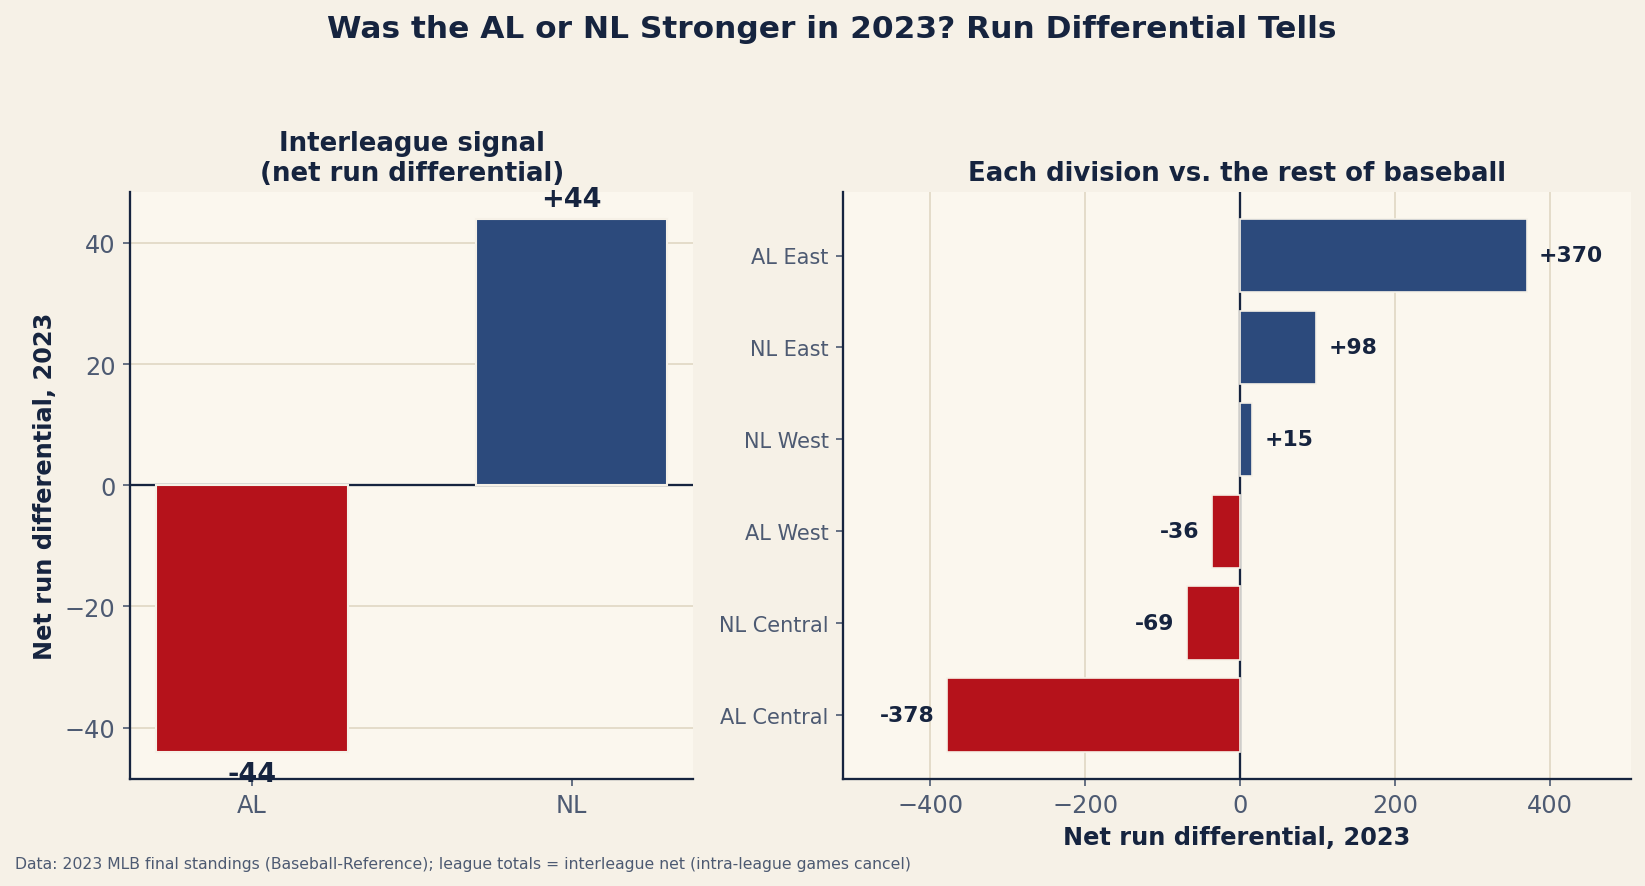
The left panel is the league verdict: the NL outscored the AL by 44 runs when they met. That’s a real edge, though a modest one — spread across the few hundred interleague games in a season, it’s a thin margin, not a rout. The NL was a little better in 2023, not dominant.
Divisions don’t cancel the same way — and that’s the better story
The right panel needs one caveat, and it’s an important one. A division’s total run differential does not isolate interleague play, because a division’s games against the rest of its own league don’t cancel within the division. So a division’s summed run differential measures something broader and still useful: that division versus the entire rest of baseball. And the spread there is enormous.
| Division | Net run differential |
|---|---|
| AL East | 370 |
| NL East | 98 |
| NL West | 15 |
| AL West | -36 |
| NL Central | -69 |
| AL Central | -378 |
The AL East was the best division in baseball by a landslide at +370 — it didn’t just beat up the NL, it beat up the rest of the AL too. The AL Central was the worst at −378, a historically soft division that got outscored by nearly everyone. Sit with what that means for the league question: the AL’s overall interleague deficit of just 44 runs is the average of a juggernaut top division and a catastrophic middle one. “The AL was slightly worse than the NL” is true on net and badly misleading about the shape — the AL in 2023 was the most top-heavy, bottom-heavy league imaginable.
Why run differential, and not interleague win-loss?
You could answer the league question with interleague records instead, and people often do. Run differential is the better tool for two reasons. First, it uses all the scoring information, not just the binary win/loss — a league that wins its interleague games by an average of four runs is more convincingly better than one squeaking by in one-run games, and records can’t see that. Second, and more practically here, the run-differential column is already in every standings table and carries the cancellation property automatically; you don’t need a separate interleague-only dataset to extract the signal. It’s the same reason run differential beats raw record as a team-strength measure — it’s the underlying scoreboard that wins and losses are a noisy summary of.
A worked example: reading one division’s number
Take the AL East’s +370. That figure is the sum of its five teams’ run differentials against everyone they played — AL East rivals, the rest of the AL, and the NL. Because games within the AL East cancel (one team’s win is a division-mate’s loss), the +370 is the division’s net margin against the other 25 teams in baseball. Four of its five teams finished well above .500 in 2023, and only one was a true bottom-feeder, so the division piled up a huge positive margin against outside competition. Contrast the AL Central’s −378: a division where one team was good and the rest were outscored relentlessly by outsiders. The two divisions are in the same league, separated by nearly 750 runs of differential against the field — which is why a single league-average number flattens a wildly uneven picture.
Where this breaks
- One season is a small interleague sample. The 44-run NL edge comes from only the interleague slice of the schedule. That’s a few hundred games, enough to be suggestive but not to crown a league for the decade. Run it across multiple years to separate signal from a single season’s noise.
- Unbalanced schedules muddy the division numbers. Teams don’t all face the same opponents equally; the 2023 schedule (the first under the balanced-ish format) still weights division and league games differently, so a division’s total partly reflects who it played, not just how well.
- Run differential isn’t immune to blowouts. A couple of lopsided games can pad a differential without reflecting broad superiority, the same way a few routs distort a team’s Pythagorean record. The league signal is robust because it pools 30 teams; a single division’s number is shakier.
- Park and run environment. Raw runs aren’t park-adjusted, so a division stacked in hitter-friendly parks looks slightly different than one in pitcher’s parks. The effect is small at the league level but worth naming.
The takeaway
The honest 2023 answer is layered. Which league was better? The NL, by 44 runs of interleague margin — real but slim. Where was the best baseball played? The AL East, which outscored the rest of the sport by 370 runs. And the worst? The AL Central, at −378. The league-versus-league debate, it turns out, is less interesting than the gulf within the American League, and you can read all of it off one column of the standings once you know what cancels and what doesn’t.
Reproduce it
This is one CSV and two group-bys. Sum RunDiff by League to get the interleague signal (it nets to zero across both leagues), and by Division to get each division versus the rest of baseball. The two-panel chart and the division table are regenerated by charts/chart_league_strength.py against data_layer/standings_2023.csv — no network, nothing hand-entered.
Sources & Further Reading
- 2023 final standings and run differentials: bundled
data_layer/standings_2023.csv, summed bycharts/chart_league_strength.py(data from Baseball-Reference). - The cancellation property (run differentials sum to zero league-wide; intra-league games cancel) is a direct consequence of every run scored being a run allowed — standard accounting, not a model.
- Related: Build a run-differential power ranking and offense or defense: what won in 2023 — run differential as the underlying scoreboard.