Originally published July 6; numbers and chart updated through the games of August 15, and again through the games of September 4, 2026. Quietly, without a juiced-ball scandal or a rules shakeup to pin it on, scoring is up. Through the games of September 4, the 2026 season is producing 8.96 combined runs per game — both teams together — which is up from 8.89 across all of 2025, up from 8.79 in 2024, and higher than every full season since 2023. One honest revision since July: the early-summer surge has cooled. The season read 9.04 on July 6, and at that rate it was flirting with the third-hottest environment of the last twelve years; at 8.96 it now sits mid-pack in the twelve-season frame — level with 2016’s 8.96, below the 2017/2019/2021/2023 surge years — while still clearly above the last two seasons. That number is the invisible backdrop to every stat you read this year, and it is still, modestly, up.
This piece does three things: puts the 2026 rate in a twelve-season frame, tests whether a mid-season snapshot can be trusted at all (short answer: yes, within about a sixth of a run — we checked four seasons of game logs, and 2026’s own July-to-August drift then landed inside that bound), and works through what a hotter environment does to the exchange rate between runs and wins.
What the run environment is, and where 2026 sits
The run environment is just the league’s scoring rate: total runs divided by games played. We’re using the combined form — both teams’ runs in one number — so an “8.96” season means an average game finishes something like 5–4. Divide by two if you prefer the per-team view: about 4.48 runs per team per game right now.
The numbers come from two pulls of the MLB Stats API: full regular-season standings for each season 2015–2025 (which carry every team’s runs scored and games played), and the live 2026 standings through the games of September 4, with 2,108 games in the books. Total runs over total games, season by season. Nothing modeled, nothing projected.
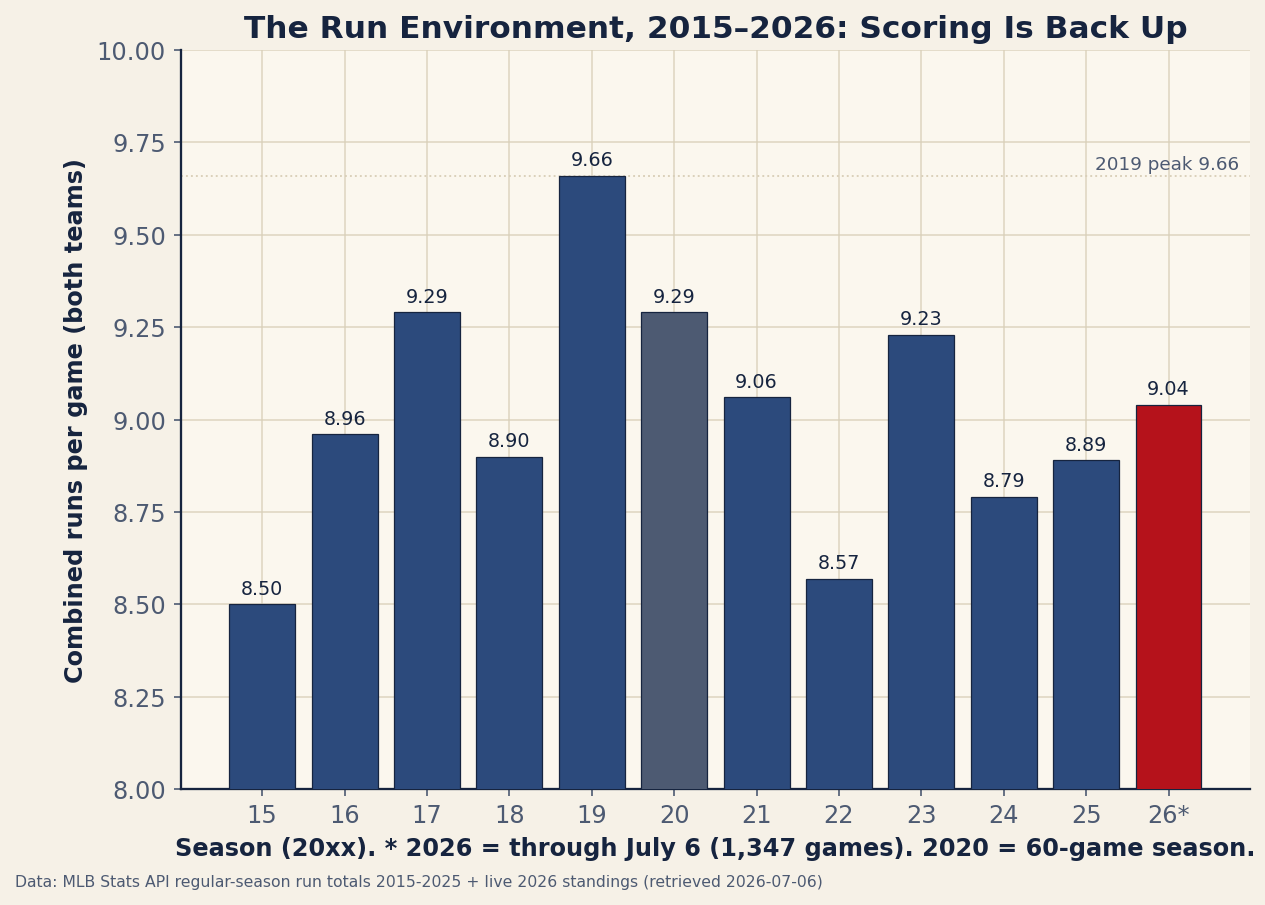
| Season | Games | Runs/game | Note |
|---|---|---|---|
| 2015 | 2,429 | 8.50 | the decade’s floor |
| 2016 | 2,427 | 8.96 | |
| 2017 | 2,430 | 9.29 | the home-run surge |
| 2018 | 2,431 | 8.90 | |
| 2019 | 2,429 | 9.66 | the modern peak |
| 2020 | 898 | 9.29 | 60-game season |
| 2021 | 2,429 | 9.06 | |
| 2022 | 2,430 | 8.57 | the recent trough |
| 2023 | 2,430 | 9.23 | new rules year |
| 2024 | 2,429 | 8.79 | |
| 2025 | 2,430 | 8.89 | |
| 2026 | 2,108 | 8.96 | through September 4 |
Can you trust a mid-season number?
The obvious objection when this piece first ran on July 6 — roughly 55% of the schedule — was that mid-season scoring rates might systematically mislead: scoring famously climbs with summer heat, so perhaps a July snapshot lowballs the final number, or the early-season cold drags it some other way. Rather than hand-wave, we pulled the full game log for each of the last four seasons and computed each year’s rate through July 6 against its final rate:
| Season | Through July 6 | Final | Drift |
|---|---|---|---|
| 2022 | 8.67 | 8.57 | −0.10 |
| 2023 | 9.16 | 9.23 | +0.07 |
| 2024 | 8.77 | 8.78 | +0.01 |
| 2025 | 8.73 | 8.89 | +0.16 |
The drift runs both directions and never exceeded 0.16 runs. The summer-heat story shows up some years (2025 added a sixth of a run after July 6) and simply doesn’t in others (2022 fell a tenth). So the honest read in July was that 9.04 was a real reading with an error bar of roughly ±0.15 — and 2026 has since become its own row in that table: the season drifted from 9.04 on July 6 to 8.95 through August 15 and 8.96 through September 4, a −0.08 move in all, comfortably inside the bound the four-season audit predicted. With 87% of the schedule now played, the remaining room to drift is smaller still. Even the bottom of the July range kept 2026 above 2024 and 2025, and both later readings have held that ranking.
The cleaner comparison sidesteps the calendar entirely: same date, year over year. At the August 15 checkpoint — the last date for which we have both seasons’ game logs — 2025 was scoring 8.84 combined runs a game and 2026 was scoring 8.95. Apples to apples, scoring was up a tenth of a run per game on last year — a real gap, but narrower than the three-tenths lead 2026 held at the same-date check in early July (9.04 to 2025’s 8.73).
Who is doing the scoring
A league rate hides a wide team spread. At the top of the 2026 scoring table sit the Cubs at 5.34 runs per game — a bats-first profile we flagged in the 2026 run-scoring map — with the Nationals next at 5.18. The prevention column: the Yankees allow a league-best 3.72 runs per game, with the Brewers — owners of baseball’s best record at 87–54 — second at 3.79 and the Braves third at 3.82. (The Dodgers, who when this piece first ran in July sat second in scoring and first in prevention, now rank fourth in both — still elite, no longer absurd.) All of it is tracked live in our self-updating 2026 season dashboard.
Why the environment changes the math
The run environment isn’t trivia; it’s the exchange rate every conversion between runs and wins depends on. Two concrete effects:
The Pythagorean exponent moves. The Pythagenpat refinement of the Pythagorean record (David Smyth’s formula) sets the exponent from the run environment itself:
Work it through: in the 8.57-run environment of 2022 the exponent is 8.570.287 ≈ 1.85; at 2026’s 8.96 it’s 1.88; at the 2019 peak it was 1.92. For a team scoring 5.0 and allowing 4.0 runs a game, the shift from the 2022 to the 2026 exponent moves the expected record from 97.5 to 97.7 wins — real, but small. It’s worth knowing mostly because people quote “the” Pythagorean exponent as a constant, when it’s an environment-dependent quantity — a wrinkle that also bears on our finding that 1.69 fit recent seasons better than the textbook 1.83.
A win costs more runs. The classic rule of thumb — roughly ten runs of differential per win, which we measured at 10.7 on 2023–24 data — scales with the environment: the more runs get scored league-wide, the more differential each win requires (the logic runs through the Pythagorean derivative; Tango, Lichtman and Dolphin walk it through in The Book’s framework). A hotter 2026 means a +100 run differential buys slightly fewer wins than the identical differential bought in 2024. When you convert a trade target’s projected runs into wins this summer, the denominator got bigger.
What we’re not claiming
- We’re not naming the cause. Decomposing a scoring change needs component data — home-run rate, BABIP, walk rate, ball-composition testing, park and weather effects — and this piece runs on run totals alone. The candidate explanations (the ball, the second season of ABS challenges, weather, bullpen usage) are checkable questions, not conclusions you can pull out of a standings file, so we won’t pretend to.
- 87% of a season is not a season. The four-year check bounded the July drift at about ±0.15 runs, and 2026’s own July-to-September move (−0.08) landed inside it; the three weeks that remain leave less room still, but the final number is not known. If 2026 finishes at 8.9, it was still a hotter-than-2024/25 year at every checkpoint; the ranking claim is more robust than the point estimate — though note the point estimate did move enough to demote the season from “third-hottest pace in twelve years” in July to mid-pack now.
- 2020’s 9.29 is a 898-game sample with no fans, regional schedules and seven-inning doubleheaders. We show it because omitting it would be cherry-picking, but treat it as its own animal.
- Environment is not quality. A hotter league isn’t a better or worse one; it’s a different denominator. Every “is X having a great year” take needs the era context before the adjective.
The bottom line
Scoring in 2026 is running at 8.96 combined runs a game through September 4 — a tenth above last year at the August checkpoint, above every full season since 2023, but off the 9.04 early-summer pace that briefly had it flirting with the surge years. A four-season audit of mid-season snapshots said the July reading was trustworthy to within about a sixth of a run, and the season then drifted exactly inside that window. The league moved the goalposts a few feet — fewer feet than it looked in July; adjust your mental exchange rate between runs and wins accordingly, and read every 2026 batting line with a modestly inflated baseline in mind.
Reproduce it
Both datasets are bundled and re-buildable. data_layer/build_run_environment.py pulls each season’s regular-season standings from statsapi.mlb.com and writes run_environment_2015_2025.json (total runs, games, and rates per season); data_layer/build_mlb_2026.py pulls the live 2026 standings into mlb_2026_standings.json; this piece cites the frozen, dated copy mlb_2026_standings_2026-09-04.json, served alongside it, so the figures above stay checkable after the next refresh. The season rate is 2 × sum(runsScored) / sum(team games). The July-6-vs-final table and the same-date 2025 comparison come from the API’s schedule endpoint (/api/v1/schedule?sportId=1&gameTypes=R for each season), summing home plus away runs for final games through the cutoff date. The chart is charts/chart_run_environment.py; re-running the standings refresh and the chart re-dates the whole piece, which is how this September update was produced.
Sources & Further Reading
- League run totals 2015–2025 and live 2026 standings: MLB Stats API, bundled as
data_layer/run_environment_2015_2025.jsonanddata_layer/mlb_2026_standings_2026-09-04.json(a frozen copy of the live standings snapshot, updated through games of 2026-09-04). - Pythagenpat: David Smyth’s environment-dependent Pythagorean exponent; background in the FanGraphs Library.
- Tango, Lichtman & Dolphin, The Book: Playing the Percentages in Baseball — the runs-to-wins framework and why the conversion scales with scoring.
- Related: The 2026 season so far (live dashboard), how many runs buy a win, which Pythagorean exponent fits best, and competitive balance 2015–2024.