Every team that finishes ahead of its run differential acquires a mythology by Thanksgiving: the bullpen built for close games, the manager’s buttons, the clubhouse that knew how to win. The claim under all of it is testable. If beating your Pythagorean record is a skill — anything a front office actually owns — the teams that do it should tend to do it again. Skills persist; luck doesn’t. So we built every team’s Pythagorean residual — actual wins minus the wins its runs scored and allowed predict — for all 120 team-seasons in the bundled 2021–2024 standings, paired each season with the same franchise’s next one, and correlated this year’s residual with next year’s across all 90 pairs.
The answer is r = +0.003. Not small — absent. Knowing a team beat its run differential by six wins tells you nothing about which side of the ledger it lands on next year. And before you file that under “the data was mute,” the same 90 pairs speak loudly when asked the control question: this year’s luck strongly predicts next year’s win change, at almost exactly minus one win per lucky win. Pythagorean luck doesn’t repeat. It un-happens.
The question three neighbors left open
This site has walked all the way around this result without stepping on it. The luckiest and unluckiest teams of 2023 named one season’s outliers and called the gap mostly luck — asserted, not tested. The run-differential piece showed Pythagorean win% out-predicts actual win% (0.57 vs 0.54), which implies the gap is noise, but never measured the gap’s own carryover. And the .500 gravity well measured how hard records regress without being able to say how much of the snap-back was evaporating luck, because its decade file has no run columns. This piece runs the direct test all three point at: is the residual a trait, or a coin flip?
Method, in one paragraph
The data is the bundled multiseason file: W, L, runs scored, and runs allowed for all 30 teams, 2021 through 2024. (The site’s longer 2015–2024 standings file carries wins and losses only — no RS/RA — so four seasons and 90 consecutive-season pairs is the honest maximum window; more on that below.) Expected wins are the Pythagorean formula with the exponent fit to this data rather than taken on faith: least squares over all 120 team-seasons gives 1.74, in line with the 1.69 this site fit to 2023 alone and below the textbook 1.83. A team-season’s residual is actual wins minus expected wins; across the file the residuals average −0.1 (centered, as they should be), the typical one is 3.0 wins in either direction, and the tails are real: 14 of 120 team-seasons missed their expectation by six or more wins. Then the test: pair every residual with the same franchise’s residual one year later, and correlate.
The flat line
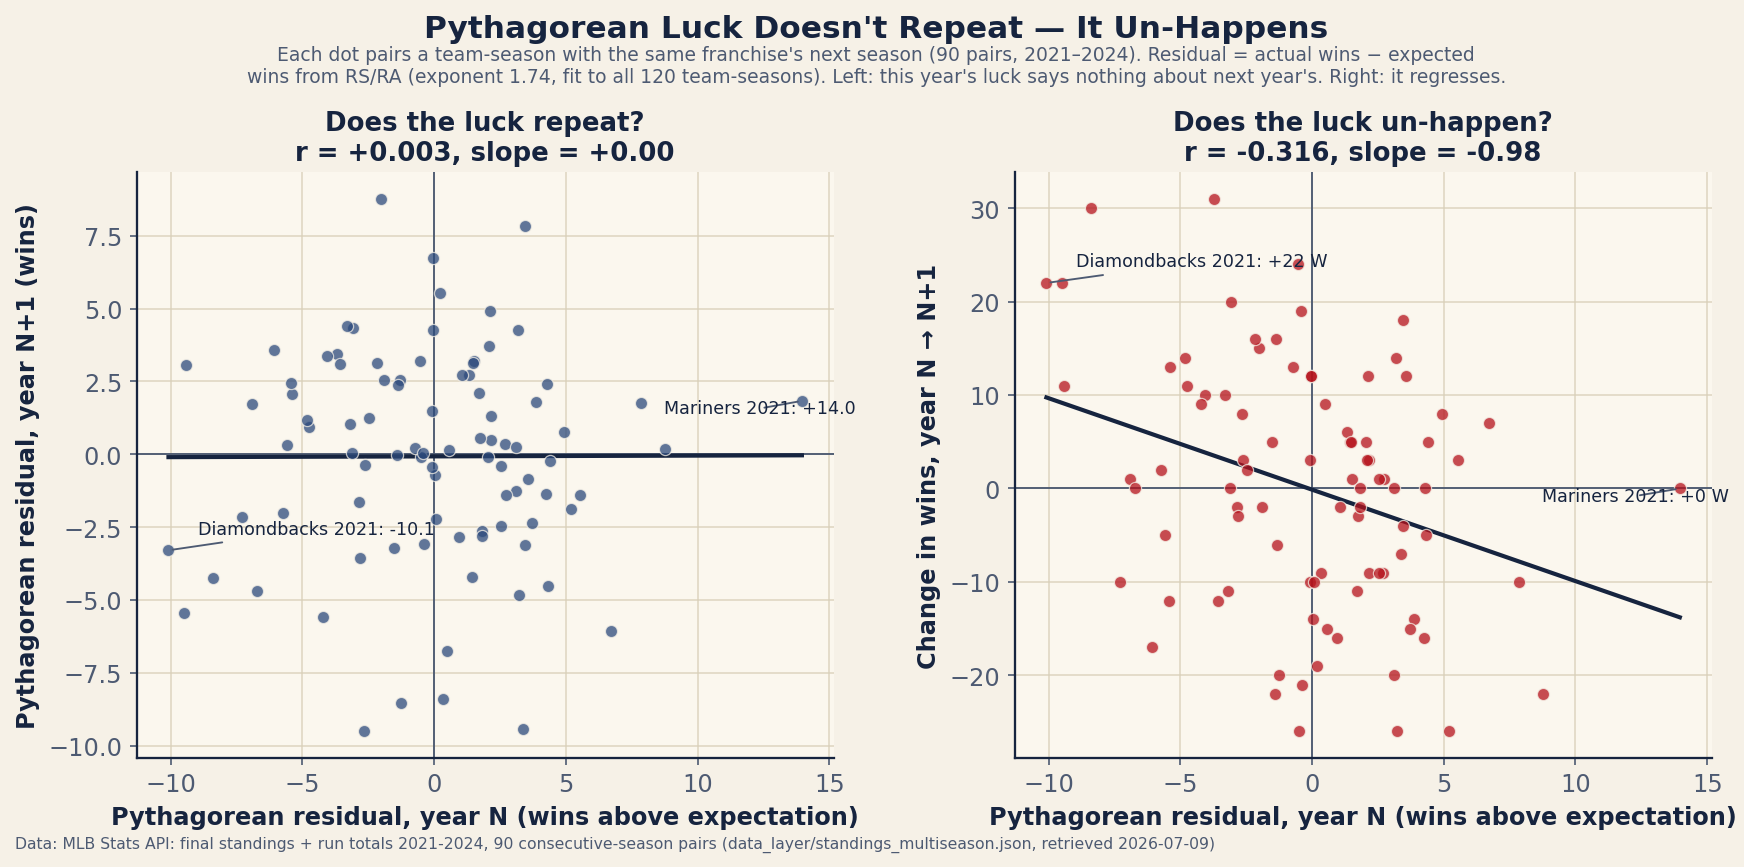
data_layer/standings_multiseason.json (retrieved 2026-07-09), charted by charts/chart_pythag_luck_persistence.py.The left panel is the headline: r = +0.003, 95% CI [−0.204, +0.210], slope indistinguishable from zero. The group version says it even more plainly than the correlation does. The 15 luckiest team-seasons in the file averaged +5.7 wins over expectation; the following year they averaged −0.9. The 15 unluckiest averaged −6.7; the following year, −0.8. Both groups — the blessed and the cursed — landed in the same place: zero, give or take a rounding error. Whatever put them in the tails did not travel with them.
The file’s single largest residual makes the case by itself. The 2021 Mariners went 90–72 while being outscored by 51 runs — 14.0 wins above expectation, the biggest overshoot in the file by five clear wins. If beating your differential is a skill, the 2021 Mariners are its Mozart. In 2022 their residual was +1.8. (They won 90 again — but honestly, with a +67 differential. The luck didn’t repeat; the team got better instead.)
The placebo: luck doesn’t repeat, it un-happens
A null on 90 pairs invites the objection that the test just can’t see anything. So here is the control. If these residuals are luck, they should predict one thing extremely well — next year’s regression: a team that won 88 games on 82-win run production should fall, not because it got worse but because the phantom wins evaporate. That prediction holds at full strength: residual versus next-season win change correlates at −0.32 (95% CI [−0.49, −0.12]), with an OLS slope of −0.98 — each win of Pythagorean luck predicts almost exactly one win handed back. The 15 luckiest teams declined by 5.1 wins on average; the 15 unluckiest improved by 6.1. The 52–110 Diamondbacks of 2021, the file’s unluckiest team, gained 22 wins in 2022; the 2022 Rangers, second-unluckiest at −9.5, gained 22 in 2023 and won a World Series. Same data, same method, same n — a strong signal exactly where luck says one should be, a dead flat line exactly where skill would have to be. That contrast, not the null alone, is the finding.
One number keeps the bookkeeping honest, because the residual and the win change share a term (this year’s wins appear in both). Correlate this year’s residual against next year’s winning percentage instead — no shared term — and you get −0.018. Luck predicts the change because it’s subtracted back out; it contains nothing at all about where the team ends up. That is the precise sense in which regression to the mean is not a force pulling teams down — it’s the accounting correction for wins that were never earned.
The eight biggest departures, and what happened next
| Team-season | Record | Run diff | Residual | Next year’s residual |
|---|---|---|---|---|
| 2021 Mariners | 90–72 | −51 | +14.0 | +1.8 |
| 2021 Diamondbacks | 52–110 | −214 | −10.1 | −3.3 |
| 2022 Rangers | 68–94 | −36 | −9.5 | −5.4 |
| 2023 Padres | 82–80 | +104 | −9.4 | +3.1 |
| 2023 Marlins | 84–78 | −57 | +8.8 | +0.2 |
| 2024 White Sox | 41–121 | −306 | −8.5 | (2025 not in file) |
| 2023 Orioles | 101–61 | +129 | +7.8 | +1.8 |
| 2024 Cardinals | 83–79 | −47 | +6.8 | (2025 not in file) |
Six of the eight have a next season in the file, and none of the six repeated anything close to their departure — the largest follow-up is the Rangers’ −5.4, and the 2023 Padres flipped sign entirely, from −9.4 to +3.1 (and from 82 wins to 93). The 2023 rows agree with the season-specific piece, which quoted the Marlins at +9 and the Padres at −10 using the textbook exponent; the fitted 1.74 shaves the decimals, not the story.
Did anyone stay lucky three straight years?
The strongest form of the skill claim is a streak, so we checked every one. Seven of the 30 franchises kept a same-signed residual three or more consecutive seasons (five positive, two negative) — and cointossing would produce more: with independent 50/50 signs, about 11 of 30 teams would show a three-streak somewhere in four seasons. Two franchises ran the table on the plus side all four years, the Pirates (+1.5, +3.2, +4.3, +2.4) and the Tigers (+1.7, +2.1, +4.9, +0.8), against roughly 3.8 expected by chance. The Pirates are the best skill candidate the file can offer, and even they are less streaky than a random-number generator’s output. The sign test is a heuristic, not a proof (residual signs aren’t perfectly 50/50 or independent), but it lands where the correlation landed: nothing here outruns chance.
Who’s “due” right now
Per the flagship’s bundled snapshot (mlb_2026_standings_2026-08-05.json, MLB Stats API, retrieved 2026-08-05, teams averaging 113.7 games — a partial-season read, not a projection), the current residual leaders are the Rays at +6.8 wins over expectation (67–46, +37 differential) and the Reds at +4.0 (54–58 despite being outscored by 62); the trailer is the Tigers at −8.8 — 55–58 with a +71 run differential. Yes: the one franchise that stayed on the lucky side all four bundled seasons is currently the unluckiest team in baseball, which is about as pointed a summary of this article as the league could have arranged. What the 90 pairs license you to say is exactly this much: nothing about anyone’s residual next season, and a lean — not a promise — that the phantom wins and losses get paid back.
Limitations, stated plainly
Four of them. First, n = 90 pairs from four seasons, and the confidence interval [−0.20, +0.21] is wide — this test would miss a modest persistence of 0.1, under half a win of carryover on a typical residual. “No detectable skill, and any undetected one is tiny” is the defensible claim; “exactly zero” is not. Second, the window is 2021–2024 because it has to be: the site’s decade file (standings_2015_2024.json) carries W/L only, no runs — we verified — so the multiseason file with RS/RA is the whole usable universe. The classic studies on longer histories find the same null; comforting, but that’s their result, not this one. Third, the exponent doesn’t matter: rerun everything at the textbook 1.83 and persistence comes out r = +0.016 [−0.19, +0.22], same flat line. Fourth, this test can’t distinguish pure luck from a real skill that churns completely year to year (a bullpen edge that dissolves with each winter’s roster turnover would also show no persistence) — but non-persistence is precisely what the luck hypothesis predicts and what the skill narrative can’t survive, and the residual’s best-known ingredients, one-run records and cluster timing, are the league’s two most reliable noise generators.
The bottom line
Beating your run differential is not a skill this data can find. The residual correlates with its own future at +0.003; the luckiest fifteen teams and the unluckiest fifteen both came back to zero; the only teams that stayed on one side of the ledger did so less often than coin flips would; and the single thing a residual reliably predicts is its own disappearance, at a rate of one win back per lucky win. When your team beats its Pythagorean record, enjoy every stolen one-run game — those wins are real and they count. Just don’t book them again next April. The standings gave them; the standings take them back.
Reproduce it
The file ships in the site’s data_layer/ (provenance in data_layer/SOURCE.txt), and both correlations fit in twenty lines:
import json, math, statistics as st
from collections import defaultdict

K = 1.737   # least-squares fit over all 120 team-seasons
D = json.load(open("data_layer/standings_multiseason.json", encoding="utf-8"))
by = defaultdict(dict)
for t in D["teams"]:
    by[t["season"]][t["team_id"]] = t

def resid(t):
    e = t["RS"]**K / (t["RS"]**K + t["RA"]**K)
    return t["W"] - e * (t["W"] + t["L"])

S = sorted(by)
pairs = [(resid(by[a][i]), resid(by[b][i]), by[b][i]["W"] - by[a][i]["W"])
         for a, b in zip(S, S[1:]) for i in by[a]]

def corr(x, y):
    mx, my = st.mean(x), st.mean(y)
    return sum((a-mx)*(b-my) for a, b in zip(x, y)) / math.sqrt(
        sum((a-mx)**2 for a in x) * sum((b-my)**2 for b in y))

r0, r1, dw = zip(*pairs)
print(len(pairs), "pairs")
print("luck vs next year's luck:       r = %+.3f" % corr(r0, r1))
print("luck vs next year's win change: r = %+.3f" % corr(r0, dw))

# output:
#   90 pairs
#   luck vs next year's luck:       r = +0.003
#   luck vs next year's win change: r = -0.316
The two-panel exhibit is charts/chart_pythag_luck_persistence.py: it refits the exponent, rebuilds all 90 pairs, and picks the labeled extremes by computed value at run time. Confidence intervals in the text are standard Fisher-z with n = 90.
Sources & Further Reading
- Standings and run totals 2021–2024: MLB Stats API, bundled as
data_layer/standings_multiseason.json(retrieved 2026-07-09); 2026 snapshot from the same source, bundled asdata_layer/mlb_2026_standings_2026-08-05.json— a frozen, dated copy of the live standings file, served alongside it so these figures stay checkable after the next refresh (retrieved 2026-08-05). - The Pythagorean expectation is Bill James’s; the non-persistence of its residuals is a long-standing sabermetric result (Baseball Prospectus and others have run longer-history versions of this same test), re-derived here from the bundled data alone.
- The neighbors this piece completes: run differential predicts next year, the luckiest and unluckiest teams of 2023, and the .500 gravity well.
Which Pythagorean exponent fits best
This section was first published on June 17, 2026 as a separate article. Data: Baseball-Reference (2023 final standings).
The Pythagorean win expectation is the most useful formula in baseball, and almost everyone who quotes it gets one detail on faith. You take a team’s runs scored and runs allowed, raise them to a power, and out comes how many games the team “should” have won. That power — the exponent — is where the faith lives. Bill James originally used 2. The modern convention is 1.83. The better question is what the data itself prefers, so this piece stops assuming and fits the exponent to a real season. Here’s the finding: for the 30 teams of 2023, the best-fit exponent is 1.69 — lower than both textbook values — and it barely matters at all. That second clause is the actual lesson.
The formula, and the one free parameter
Pythagorean expected wins are:
expected wins = games × RS^k / (RS^k + RA^k)where RS is runs scored, RA is runs allowed, and k is the exponent. The shape is the whole idea: outscore your opponents and your expected win total climbs, steeply near .500 and flattening at the extremes. James picked the name because RS² / (RS² + RA²) looks like the Pythagorean theorem; the squared version was a first guess, not a derived truth. People later noticed that a slightly smaller exponent tracked actual records a touch better, and 1.83 became the house number on Baseball-Reference and in most analysis you’ll read. But “a touch better” on what data, by how much? That’s answerable.
Let the season pick the exponent
The method is brute-force and honest: take every 2023 team’s real RS, RA, and games, compute expected wins across a whole range of exponents, and for each exponent measure the root-mean-square error against what teams actually won. The exponent that minimizes that error is the one 2023 “wanted.” No assumption goes in; the standings decide.
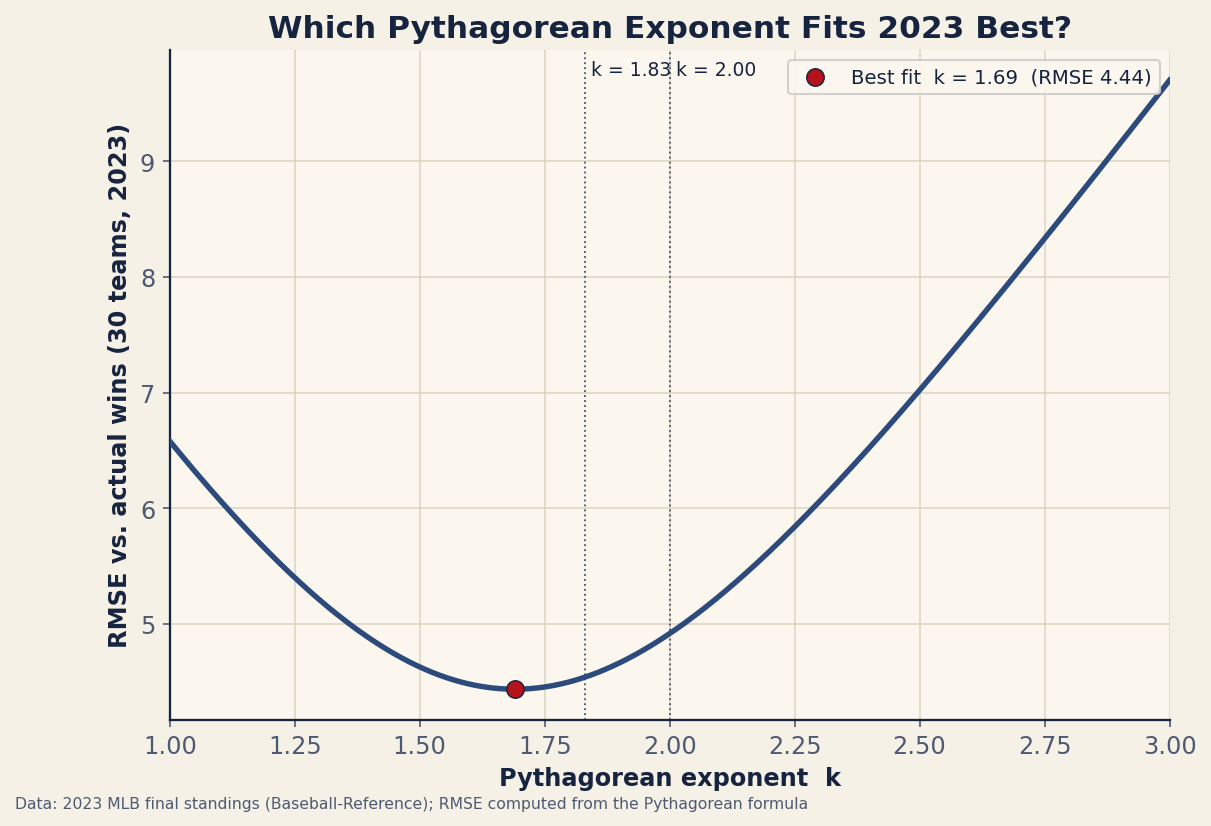
Two things jump out of that curve. First, the minimum sits at k = 1.69, not at 1.83 or 2. Second — and this is what matters — the curve is shallow near the bottom. The error at the textbook 1.83 is 4.54 wins; at the best-fit 1.69 it’s 4.44. You buy yourself one-tenth of a win of average accuracy by abandoning the standard exponent for a hand-fit one. Across 30 teams, that is nothing.
| Exponent | Where it comes from | 2023 RMSE (wins) |
|---|---|---|
| 1.50 | A deliberately low value | 4.63 |
| 1.83 | Modern sabermetric standard | 4.54 |
| 2.00 | Bill James's original exponent | 4.92 |
| 1.69 | Best fit to 2023 (this analysis) | 4.44 |
James’s original 2.0 is the worst of the three at 4.92 wins of error, which is the kernel of truth behind the move to 1.83 — squaring slightly overstates how much a big run differential should translate into wins. But notice the whole table lives between 4.4 and 4.9 wins of error. The exponent is a knob that, within any sane range, hardly turns the machine.
A worked example — and why the exponent fools you on the good teams
Take the 2023 Braves: 947 runs scored, 716 allowed, 162 games, and an actual 104 wins. Run their numbers at each exponent:
k = 1.69 -> 162 × 947^1.69 / (947^1.69 + 716^1.69) = 99.8 wins
k = 1.83 -> 101.3 wins
k = 1.89 -> 101.9 wins
k = 2.00 -> 103.1 wins
Here is the twist the league-wide fit hides. For the Braves, the exponent matters a lot — a 3.3-win spread from 99.8 to 103.1 — and the value that fits the whole league best (1.69) fits the Braves worst. They actually won 104, closest to James’s much-maligned 2.0. That’s not a coincidence: a bigger exponent rewards large run differentials harder, so it flatters dominant teams and punishes them less for blowout-inflated run totals. The 1.69 minimum wins the season because most of the league clusters near .500, where the exponent barely moves the answer, and a handful of extreme teams quietly get worse estimates. An exponent fit to all 30 teams is a compromise that fits none of the interesting ones especially well. Plug the Braves into the Pythagorean calculator below and you can watch the estimate slide as you change the inputs.
Interactive tool
Pythagorean Win Expectation
Expected winning percentage and a projected W–L record from runs scored and runs allowed. This interactive calculator needs JavaScript. The formula it uses is printed on this page, so the method works without it.
The grown-up answer: don’t use a constant at all
If the best exponent shifts with how extreme a team is, it should also shift with the run environment — and it does. The refinement the field actually settled on is Pythagenpat (David Smyth and Clay Davenport’s related Pythagenport), which makes the exponent a function of scoring: k = (runs per game)^0.287. In a high-scoring era each run is worth a little less, so the exponent rises; in a pitchers’ era it falls. For 2023, the league averaged 9.23 runs per game, which Pythagenpat turns into an exponent of 1.89 — essentially right back to the textbook neighborhood. That’s the reassuring part: the static 1.83 works because it’s a sensible average of what a variable exponent would give you across normal modern run environments. The constant is a shortcut for the formula that’s actually correct, not a rival to it.
Where this breaks
We want to be clear about how little this proves:
- One season, thirty points. A best-fit of 1.69 from 30 teams is itself a noisy estimate. Run 2022 or 2021 and the minimum will land somewhere else — often above 1.83. Pooling many seasons is the only way to pin an exponent down, and that pooled answer is roughly the 1.83–1.85 the convention already uses. The single-season “winner” is mostly an artifact of that year’s extreme teams.
- The exponent isn’t the error. Even at its best, the formula misses some teams by a lot — the 2023 Padres won 10 fewer games than expected and the Marlins about 9 more. No exponent fixes that. Those residuals are timing: record in one-run games, bullpen sequencing, the cluster luck that decides which runs actually turned into wins. The exponent argument is a rounding-error debate happening on top of a much larger, more interesting source of miss.
- It’s descriptive, not predictive. Fitting the exponent to a finished season tells you what already happened. For projecting next year you want the stable, run-environment-aware version, not a number reverse-engineered from one set of final standings.
Reproduce it
Everything here comes from one CSV of 2023 final standings and the formula above. The sweep is a few lines: for each candidate k, compute games × RS^k / (RS^k + RA^k) for all 30 teams, take the RMSE against actual wins, and keep the k with the smallest error. The curve, the best-fit point, and the comparison table are regenerated by charts/chart_pythag_exponent_fit.py against the bundled data_layer/standings_2023.csv — no network, nothing hand-entered. Point it at another season’s standings and it will tell you that year’s “best” exponent, and almost certainly that it didn’t matter much either.
Sources & Further Reading
- 2023 final standings (G, W, RS, RA): bundled
data_layer/standings_2023.csv, swept bycharts/chart_pythag_exponent_fit.py(data from Baseball-Reference). - Bill James — the original Pythagorean win expectation (exponent 2) from the Baseball Abstract; the 1.83 refinement is documented in MLB.com’s glossary entry for Pythagorean winning percentage.
- David Smyth / “Patriot” (Pythagenpat) and Clay Davenport (Pythagenport) — the run-environment-dependent exponent, via SABR and Baseball Prospectus.
- Related: The luckiest and unluckiest teams of 2023 — the residuals no exponent fixes.
- Related: Offense or defense: what won in 2023? — the runs-to-wins relationship underneath this.
- Related: Build a run-differential power ranking — the same engine, applied.