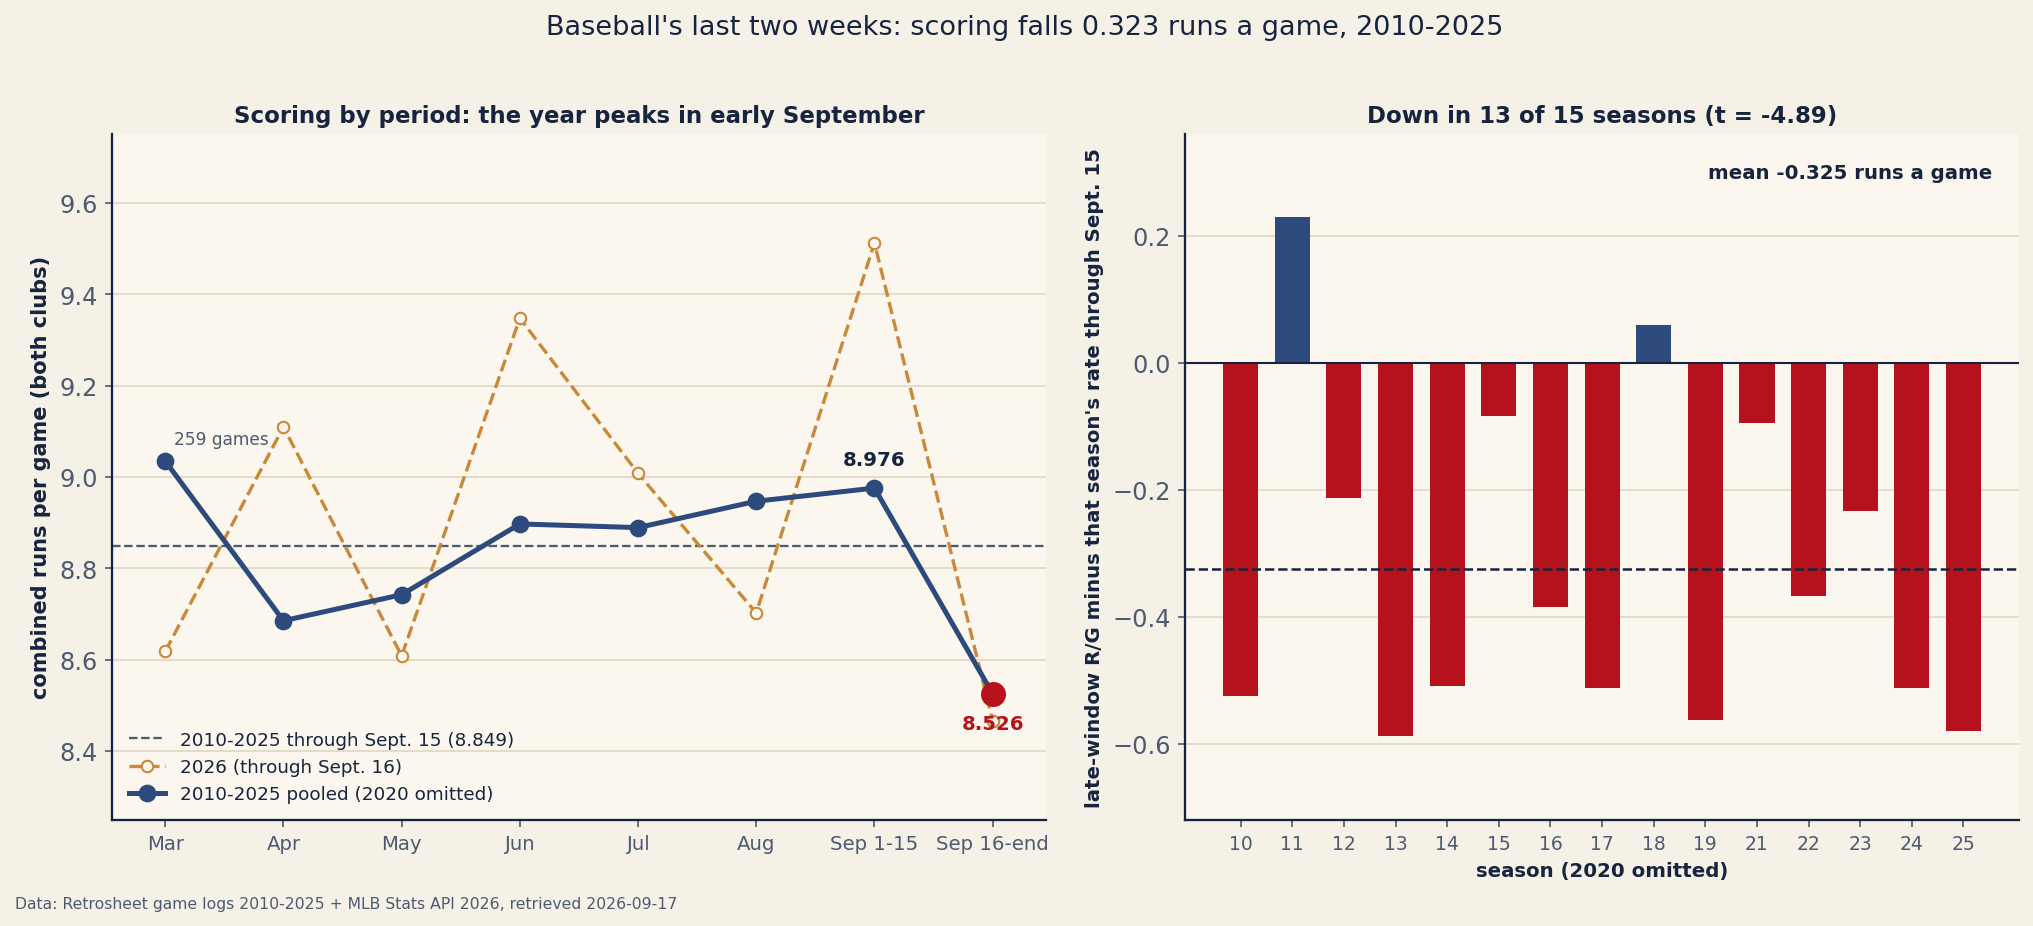
Baseball’s last two weeks are the quietest scoring stretch of the season, and the margin is not close. Across the fifteen regular seasons from 2010 through 2025, with 2020 left out, games played from September 16 to the end of the schedule produced 8.526 combined runs a game. The 33,165 games before that date produced 8.849. The difference is 0.323 runs a game, 3.65 percent of the league’s scoring, and it puts the closing fortnight below April — the cold month everyone already discounts — by a sixth of a run.
What makes that worth writing down is the half-month immediately before it. September 1 through 15 is the highest-scoring period of the entire season: 8.976 runs a game, ahead of August’s 8.947 and every other stretch of the calendar. September is not a cold month. It is two months stapled together, and as of today, September 17, the league has just crossed the seam.
The shape of a season
Here is the whole calendar, pooled across the fifteen seasons. Every figure comes from Retrosheet’s regular-season game logs, and every club’s wins, losses, runs scored and runs allowed in the parse were checked against the MLB Stats API’s own final standings before any of it was tallied.
| Period | Games | Runs/game | HR/game | K/game |
|---|---|---|---|---|
| March | 259 | 9.035 | 2.27 | 17.44 |
| April | 5,561 | 8.685 | 2.07 | 16.22 |
| May | 6,286 | 8.742 | 2.16 | 15.88 |
| June | 6,038 | 8.897 | 2.24 | 15.92 |
| July | 5,672 | 8.889 | 2.23 | 16.01 |
| August | 6,289 | 8.947 | 2.30 | 15.98 |
| Sept. 1–15 | 3,060 | 8.976 | 2.27 | 16.43 |
| Sept. 16–end | 3,280 | 8.526 | 2.10 | 16.57 |
March is 259 games of season openers and we show it for completeness, not for weight. The full months tell a tidy story: scoring climbs out of April, plateaus through midsummer, peaks in the first half of September, and then falls off a step no other month matches.
It is not an artifact of where we cut
The obvious objection is that September 15 is a line we drew. So we moved it. Cutting after September 10 gives a gap of −0.284 runs a game; after the 13th, −0.291; after the 15th, −0.323; after the 16th, −0.348; after the 18th, −0.315; after the 20th, −0.390. Every cut lands between a quarter and two-fifths of a run. The boundary moves the number a little and the conclusion not at all.
Cut finer and the slide is visible day by day. September 1–5 runs 9.394, then 8.824, then 8.708, then 8.685, then 8.608, then 8.492 over the 26th through the 30th — six consecutive five-day blocks, each one lower than the last. The handful of regular-season games that spill into October, 333 of them across the fifteen seasons, produced 7.880. Measure the same thing by each season’s own finish line rather than by the calendar and it holds: the last five days of a season score 8.247, the lowest block on the board.
Nor is it one or two strange years carrying the average. Measuring inside each season — that season’s late window against that season’s own rate through September 15 — the gap is negative in 13 of 15, with a mean of −0.325 and a standard deviation of 0.256, which puts the mean 4.89 standard errors from zero. The two exceptions are 2011 (+0.230) and 2018 (+0.059); the deepest are 2013 (−0.589), 2025 (−0.581) and 2019 (−0.562). One caveat we will not bury: pooled, the late window is the season’s floor, but season by season it finishes last among the full periods only 8 times in 15. The signal is a league-level one, and individual seasons are noisy enough to hide it.
What actually disappears
Runs are a compound of things, and the components move in a way that is at least legible. Set the season through September 15 against the closing window:
| Measure | Through Sept. 15 | Sept. 16–end | Change |
|---|---|---|---|
| Runs | 8.849 | 8.526 | −0.323 |
| Home runs | 2.206 | 2.104 | −4.6% |
| Strikeouts | 16.048 | 16.571 | +0.52 |
| Walks | 6.240 | 6.271 | +0.03 |
| Batting average | .2511 | .2467 | −4 points |
| Pitchers used | 8.24 | 9.15 | +0.91 |
Fewer homers, more strikeouts, four points off the batting average, and walks unchanged. That is the signature of contact getting worse rather than of hitters getting more passive, which is roughly what the home-run-to-run-scoring relationship would predict if the ball stopped carrying. It is also what you would expect from colder air, and the season’s other cold end supports the reading: April sits at 8.685 with the year’s second-lowest home-run rate. We have no temperature data in this dataset, so that is a consistency, not a proof.
The mechanism people usually reach for is the roster. Clubs may carry 28 players in September instead of 26, and before 2020 they could activate anyone on the 40-man. Pitchers used per game does jump, from 8.24 to 9.15. But it jumps in both halves of September — the September 1–15 figure is 8.97, and that is the highest-scoring stretch of the year — so extra arms cannot explain a direction change. The era split closes the door. Under the old 40-man Septembers of 2010–2019, pitcher usage rose from 8.07 to 9.23 and the gap was −0.308. Under the 28-man cap of 2021–2025, usage rose only from 8.57 to 9.01 and the gap was larger, −0.355. Cap the call-ups and the slide gets no smaller.
Whose runs go missing
Split the 450 team-seasons by final winning percentage and the loss is not evenly shared. Clubs that finished at .550 or better scored 4.807 runs a game through September 15 and 4.790 after it — a change of 0.017, which is nothing. Clubs between .450 and .550 dropped 0.198. Clubs under .450 dropped 0.261. Meanwhile every group allowed fewer runs late, the good clubs most of all (−0.199).
Good offenses do not fade in the last two weeks; bad ones do, and everyone’s pitching plays better. This site has already tested the nearby claim that out-of-contention clubs stop competing and found that they do not stop winning — a quarter of a win per September, well inside the noise. Runs are a finer instrument than wins, and they show something the win column cannot: the bottom of the league scores less in the closing fortnight while the top of it does not. Whether that is rested regulars, a young lineup, or a September schedule that hands contenders the weaker end of the pitching pool, run totals alone cannot say.
A worked example: Houston’s cold fortnight
The practical use of a league-wide effect is to subtract it before you blame anybody. Take the Astros, who through the games of September 15 had scored 673 runs in 151 games, a rate of 673 ÷ 151 = 4.457 per game, and who then scored 43 runs in their 13 games from September 1 to 15: 43 ÷ 13 = 3.308. That is a fall of 1.149 runs a game, the largest in baseball over that stretch, and it arrived exactly when a team with something to play for least wants it.
The calendar adjustment is one multiplication. The closing window historically runs at 8.526 ÷ 8.849 = 0.9635 of the pre-September-16 rate, so the Astros’ season-long rate translates to an expected:
So the calendar is worth 0.163 runs a game to Houston, about one-seventh of the 1.149 they actually lost. Six-sevenths of that slump is Houston. Run the same arithmetic on the other end — the Brewers scored 97 runs in 13 games from September 1 to 15, a 7.462 rate against a season figure of 5.185 — and the adjustment expects 4.996 a game from them the rest of the way, a long way under what the last fortnight would suggest. The effect documented here is real, statistically clean, and far too small to explain any single club’s two weeks. That is the honest use of it.
2026 crosses the line today
These numbers were pulled on the morning of September 17, before any of that day’s games, and run through the games of September 16: 2,285 decided games and 20,526 runs, a season rate of 8.983. Through September 15 the season sat at 8.986, and its September 1–15 stretch was extraordinary — 9.512 runs a game over 201 games, more than half a run above the 15-season norm for that window, with home runs at 2.44 a game against a season figure of 2.30. The first day inside the window, September 16, produced 8.467 across 15 games, which is one day and means nothing yet.
What is left is 145 games, every one of them after September 15, through a final scheduled day of September 27. If the historical gap holds, 2026’s rate through September 15 translates to 8.986 × 0.9635 = 8.658 runs a game the rest of the way, and the league scores roughly 47 fewer runs over those 145 games than its own season rate implies. That is the backdrop for every remaining race — the strength-of-schedule map prices opponents, this prices the calendar — and for every September batting line that is about to look worse than the season that produced it. The live table is in the 2026 dashboard, and the season-long scoring context in the run-environment piece, which flagged the summer-heat question this one answers.
Limitations, stated plainly
This runs on run totals and game logs, which bounds what it can claim. There is no temperature, wind or park-mix data in it, so “cold weather” stays a plausible reading rather than a finding; the share of day games actually falls slightly in the window (34.9% to 32.3%), which rules that out as the driver but not much else. The period boundaries are this piece’s choice, and while the sweep above shows the result survives every reasonable cut, October games are only 333 of 3,280 and they are the most extreme; drop them entirely and the September 16–30 window still comes in at 8.599, a gap of −0.250. The t-statistic treats fifteen seasons as fifteen independent draws, which overstates precision if scoring regimes persist across years — and they plainly do, which is exactly why the gap is measured inside each season rather than against a pooled mean. The .550 and .450 splits are bright lines chosen after seeing the monotone pattern, not before. And a league-average factor applied to one club assumes the effect scales with a team’s own rate, which is an assumption, not a measurement. It is a small adjustment used as a small adjustment; a club’s own thirteen games carry several times more noise than the entire calendar effect.
Reproduce it
Two frozen files from one pull. data_layer/late_scoring_2010_2026_2026-09-17.json carries, for every season 2010–2025 plus 2026, a day-level league table (games, runs, home runs, strikeouts, walks, at-bats, hits, pitchers used, day games) and a team-by-period table of games, wins, runs scored and runs allowed. It is built by data_layer/build_late_scoring_2010_2026.py from Retrosheet game logs and the MLB Stats API, and every club’s W, L, runs scored and runs allowed must match the API’s standings exactly or the build aborts; 2026’s component rates come from the API’s byDateRange endpoint and are cross-checked against the schedule feed in all four windows. The second file is data_layer/mlb_2026_standings_2026-09-17.json. The chart-and-verification script charts/chart_late_scoring.py recomputes every figure above from those two files and asserts each against the published value — the period table, the component table, all fifteen season gaps, the six boundary cuts, the September blocks, the blocks before each season’s final day, the era split, the three club groups, the 2026 figures and both worked examples.
Sources & Further Reading
- Retrosheet game logs, regular seasons 2010–2025. The information used here was obtained free of charge from and is copyrighted by Retrosheet. Interested parties may contact Retrosheet at www.retrosheet.org.
- MLB Stats API: final standings for every season 2010–2025 (used to validate the parse club by club), the 2026 schedule feed, and 2026 team stats by date range, retrieved 2026-09-17.
- MLB.com, “What to know about Sept. roster expansion”: 28-man September rosters, and expansion up to the full 40-man before 2020.
- The 2026 Run Environment: where this season’s scoring rate sits in a twelve-season frame, and the mid-season drift question this piece finishes.
- How Much Does the Home Run Drive Run Scoring? The component that moves most in the closing window.
- Do Out-of-It Teams Quit in September? The same fortnight measured in wins instead of runs.
- The Strikeout Era: the long trend the late-September strikeout bump sits on top of.
- Park Factors, Explained: why a scoring rate always needs its context named.