The White Sox won the first two games of their Division Series in Cleveland, 3–0 and 4–3, and lost the third at home on Wednesday, 9–3. They lead 2–1 with Game 4 in Chicago tonight, and both League Championship Series start within four days. Somebody will call whatever happens next momentum. We wanted to know what a series lead has actually been worth, so we pulled every postseason game since 1903 and asked the plainest question there is: how often did the team in front finish in front?
The answer is that a lead has been worth almost exactly what flipping coins says it should be. Win Game 1 of a best-of-seven and the coin gives you 65.6%; Game 1 winners have taken 127 of 197 such series, 64.5%. Lead 3–1 and the coin gives 87.5%; leaders went 82 for 96, 85.4%. Momentum, tested directly, does not show up. Home field does, and the one lead the coin overprices by more than a few points is a 3–2 lead, most of all when the last two games are on the road.
How the table was built
The MLB Stats API lists every postseason game back to the 1903 World Series. We pulled all of them, 1,901 games through October 7, 2026, along with every club’s regular-season record, and checked each game from 1903 to 2025 against Retrosheet’s postseason game logs, a separate record kept by different people. All 1,878 matched on date, both clubs and both scores, with nothing left over on either side. Three tied games, in the 1907, 1912 and 1922 World Series, stay in the record as games and count as a win for nobody.
From 1903 to 2025 that makes 403 completed series: 197 best-of-sevens, 160 best-of-fives, 24 best-of-three Wild Card Series, four best-of-nine World Series (1903 and 1919–21) and 18 single wild-card games. The last two groups have no series states worth tabling, which leaves 381 series. For each one we followed the score game by game, recorded every lead it passed through, and noted whether the leader went on to win.
Two expectations sit beside what happened. The coin treats every game as 50–50, so a lead’s value is binomial arithmetic: up 2–0 in a best-of-five, the trailer has to win three straight, and 1 − (1/2)³ = 87.5%. The records model replaces the coin with the two clubs’ regular-season records, pulled part of the way back to .500 (the next section explains how far) and combined with Bill James’s log5.
What each lead has been worth
| Format | Lead | Times | Leader won | Share | Coin flip | Records model |
|---|---|---|---|---|---|---|
| Best of seven | 1–0 | 197 | 127 | 64.5% | 65.6% | 65.7% |
| Best of seven | 2–0 | 95 | 79 | 83.2% | 81.3% | 81.7% |
| Best of seven | 2–1 | 155 | 109 | 70.3% | 68.8% | 68.0% |
| Best of seven | 3–0 | 42 | 41 | 97.6% | 93.8% | 94.4% |
| Best of seven | 3–1 | 96 | 82 | 85.4% | 87.5% | 87.4% |
| Best of seven | 3–2 | 117 | 80 | 68.4% | 75.0% | 74.9% |
| Best of five | 1–0 | 160 | 116 | 72.5% | 68.8% | 70.1% |
| Best of five | 2–0 | 93 | 83 | 89.2% | 87.5% | 88.6% |
| Best of five | 2–1 | 106 | 77 | 72.6% | 75.0% | 75.0% |
| Best of three | 1–0 | 24 | 21 | 87.5% | 75.0% | 74.5% |
In eight of the ten rows, what happened lands within four points of the coin. The two exceptions run in opposite directions. Best-of-three leaders won 21 of 24 against the coin’s 75%, and best-of-seven teams up 3–2 won only 80 of 117, 68.4% against 75.0%. Neither is beyond what chance produces. The 3–2 row is the largest miss in the table at 1.65 standard errors, a gap luck alone opens about one time in ten, and with ten rows the chance that at least one sits that far out would be about 64% if the rows were independent tests. They are not quite independent, since one series passes through several leads, but the point stands: the table is a coin with noise in it.
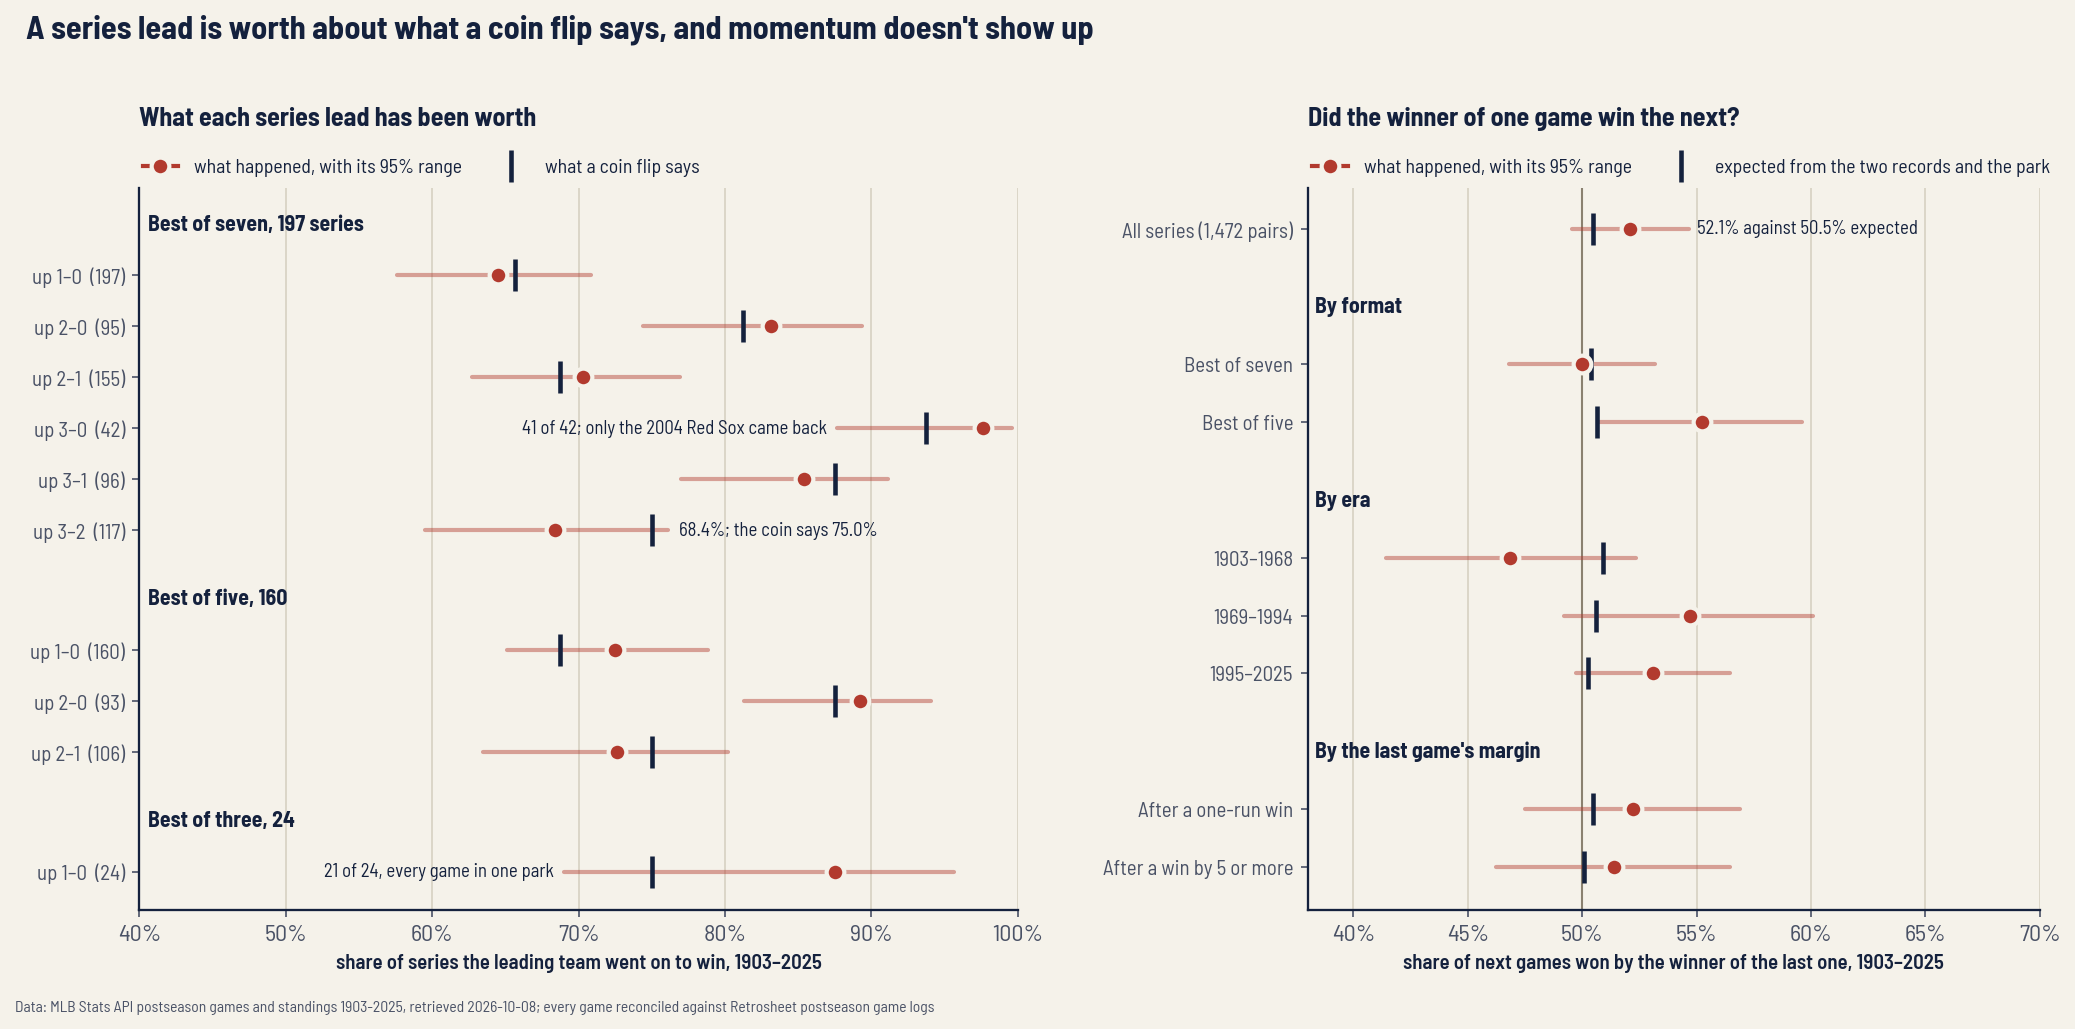
The famous comebacks fit inside those numbers rather than against them. Teams down 3–0 in a best-of-seven have come back once in 42 tries, the 2004 Red Sox against the Yankees. The coin says one in 16, which over 42 series is 2.6 comebacks, so one is fewer than chance, not more. Down 3–1, 14 of 96 teams came back (14.6%, against the coin’s 12.5%). In best-of-fives, 10 of 93 teams came back from 0–2, most recently the 2017 Yankees against Cleveland.
Why a coin is the right baseline
The obvious objection is that postseason games are not coin flips, because one club is usually better. The records model is the test of that objection, and it barely moves anything: no row’s expectation changes by more than 1.4 points, the largest being best-of-five Game 1 winners, 68.8% to 70.1%. October pairs good teams with good teams, and a regular-season record overstates the gap between them.
Across the 2,630 team-seasons from 1903 to 2025, winning percentage has a standard deviation of .082. Coin-flip luck over the same schedules would spread records by .040 on its own, which is 24.3% of the variance, so before comparing two clubs we pull each record 24.3% of the way back to .500. That is the same correction our piece on regression to the mean describes. Take this year’s NL Championship Series. The Brewers went 103–59 (.636) and the Dodgers 100–62 (.617); pulled toward .500, those become .603 and .589, and log5 combines them:
Three wins of regular-season difference is worth 51.5% a game on neutral ground. Add the home edge measured below and the Brewers are 55.6% in Milwaukee and 47.3% in Los Angeles. With Games 1, 2, 6 and 7 at home, that makes them 54.5% to win the series, against the coin’s 50%. For most October matchups the coin is a rough model of a single game and a very good model of what a lead is worth, which is also why the best team so often loses in October.
Momentum, tested
The lead table cannot say whether winning a game makes the next one easier, because a lead already counts the game that produced it. The direct test is to take every pair of consecutive decided games inside a series, 1,472 of them from 1903 to 2025, and ask how often the winner of the first also won the second.
If momentum were a real force, that rate would sit well above what the two clubs’ strength and the park predict. It is 52.1% (767 of 1,472). The records-and-park model, which knows nothing about who won the game before, expects 50.5%. The gap is 1.6 points, or 1.3 standard errors, inside the noise. In best-of-sevens, which hold most of the pairs, it is zero: 50.0% against 50.4%.
Cutting the pairs other ways does not produce a consistent story. After a win by five or more runs, the winner took the next game 51.4% of the time (50.1% expected); after a one-run win, 52.2% (50.5% expected), so a blowout carries no more than a close win. The eras disagree with each other: 1903–68 ran below the model, 46.8% against 50.9%, while 1969–94 and 1995–2025 ran above it at 54.7% and 53.1%. Best-of-fives are the one slice that leans, 55.2% against 50.6%, just over two standard errors. With the same pairs cut eight ways, one cut that far out is not unusual, and the best-of-sevens, with nearly twice as many pairs, show nothing. We read it as noise. It is where a case for momentum would have to start. The overall answer, no measurable carryover, matches what our hot-September piece found across the season boundary.
Where the coin misses: the next game’s park
Home field is the part of October that the records cannot explain. Home teams won 990 of the 1,822 decided postseason games played in their own parks from 1903 to 2025, 54.3%, where the two clubs’ records alone would have predicted 50.2%. That gap is about 3.5 standard errors, and fitted as a single edge it makes the home side 54.2% between even clubs. (The 2020 rounds after the Wild Card Series, played at four neutral parks, and the 1921, 1922 and 1944 World Series, each played in one shared park, are left out of that count.) The edge has moved by era, 51.5% from 1903 to 1968, 57.7% from 1969 to 1994 and 54.0% since, and it is the same small, real edge our home-field piece describes for the regular season.
A series format decides where the remaining games are played, and a 2–3–2 best-of-seven puts Games 6 and 7 in the same park. A team up 3–2 therefore has both left at home or both on the road; in every series that went seven after a 3–2 lead, Game 7 was played where Game 6 was. Between even clubs the arithmetic is:
Both games on the road: 1 − 0.5415² = 70.7%
The coin’s 75% averages that eight-point difference away. The record shows the split, with both sides lower:
| Situation | Times | Leader won | Share | Coin flip |
|---|---|---|---|---|
| Up 3–2 in a best of seven, Games 6 and 7 at home | 57 | 42 | 73.7% | 75.0% |
| Up 3–2 in a best of seven, Games 6 and 7 on the road | 56 | 35 | 62.5% | 75.0% |
| Up 2–1 in a best of five, Game 4 at home | 51 | 39 | 76.5% | 75.0% |
| Up 2–1 in a best of five, Game 4 on the road | 53 | 36 | 67.9% | 75.0% |
| Won Game 1 of a best of seven at home | 111 | 75 | 67.6% | 65.6% |
| Won Game 1 of a best of seven on the road | 81 | 49 | 60.5% | 65.6% |
The records-and-park model expects 79.2% for the 3–2 leaders with both games at home and 70.0% for those on the road. The 11.2-point gap between the two groups is close to the 9.2 points it predicts, so the split is mostly the park. Both groups still finished below the model, 80 conversions where it expected 87.5, a shortfall of 1.6 standard errors that sits inside what chance does. The other two splits in the table lean the same way: 76.5% against 67.9%, and 67.6% against 60.5%. Not every split does: best-of-five Game 1 winners did slightly better on the road (52 of 70, 74.3%) than at home (61 of 86, 70.9%). That gap is half a standard error, and a reminder that the park moves a lead’s value by a few points, not a dozen.
Best-of-three Wild Card Series are the extreme case, because every game is in the higher seed’s park. Home teams that won Game 1 won all nine of those series from 2020 to 2025, and visitors that won Game 1 won 12 of 15. Both are above what the park alone predicts between even clubs (79.0% and 70.7%), on samples too small to read much more into.
2026, as of October 8
Seven series have finished this October, four Wild Card Series and three Division Series, and the Game 1 winner took all seven. A coin makes seven for seven about a one-in-ten event (0.75⁴ × 0.6875³ = 0.103), so it is a little lucky and not much more.
The eighth is the White Sox and the Guardians. Chicago leads 2–1 after winning twice in Cleveland and losing Game 3 at home, with Game 4 in Chicago tonight and a Game 5, if needed, back in Cleveland on Saturday. Best-of-five teams that won the first two games and lost the third went on to win 29 of 39 times (74.4%), and teams up 2–1 with Game 4 at home won 39 of 51 (76.5%). On the model, with the White Sox at 84–78 and the Guardians at 85–77, Chicago is 53.7% to win tonight and 45.4% in a Game 5, so 0.537 + 0.463 × 0.454 = 74.7% to take the series. The coin says 75%.
Both League Championship Series open in the higher seed’s park: the Dodgers at the Brewers on Sunday, and the Rays at home against the Cleveland–Chicago winner on Monday. Best-of-seven Game 1 winners have won 127 of 197 series; home teams that won Game 1 took 75 of 111 (67.6%), visitors 49 of 81 (60.5%). The final regular-season records behind this year’s seeds are on the 2026 season page.
What this does not say
Four limits, stated plainly. First, the records model sees only regular-season winning percentage: not the rotation a club lines up, injuries, or a deadline trade. It is a check on the coin, not a forecast; why playoff-odds models disagree covers what fuller models add. Second, 121 postseasons of formats are pooled. Early World Series alternated parks or were played in one city, best-of-fives have been played 2–3 and 2–2–1, and the 2020 rounds after the Wild Card Series had no home parks at all. The venue splits therefore use only games that were actually played, plus the Game 6 and Game 7 park rule, which held in every case it could be checked. Third, the samples are small where the drama is: 117 series reached 3–2, 42 reached 3–0, and only 24 best-of-threes were played before this year, so a difference of a few points in any one row is not a finding. Fourth, the momentum test sees only what carries from one game to the next. A team that plays better after a big comeback inside a game, or after a day off, is a different question that this table does not ask.
The bottom line
A series lead is worth the games it represents and very little else. The coin’s arithmetic prices up 2–0 or up 3–1 to within a few points, the clubs’ records add a point or so, and the winner of one game has been no more likely to win the next than the matchup and the park say. What does carry from one game to the next is the schedule. Where the next games are played moves a lead’s value by several points, which is why a 3–2 lead that has to finish on the road is the most fragile position in the table, and why the White Sox would rather end it tonight than in Cleveland.
Reproduce it
The dataset ships in the site’s data_layer/ (provenance in data_layer/SOURCE.txt), built from the MLB Stats API and Retrosheet by build_postseason_series_1903_2026.py. The lead table is a walk through each series:
import json
from collections import defaultdict

path = "data_layer/postseason_series_1903_2026_2026-10-08.json"
js = json.load(open(path, encoding="utf-8"))
tally = defaultdict(lambda: [0, 0])  # (best_of, lead, trail): [n, won]
for s in js["series"]:
    if s["season"] > 2025 or s["best_of"] not in (3, 5, 7):
        continue
    a, b = [t["id"] for t in s["teams"]]
    w = {a: 0, b: 0}
    for g in s["games"]:
        if g["win"] is None:           # the 1907, 1912 and 1922 ties
            continue
        w[g["win"]] += 1
        if max(w.values()) == s["need"]:
            break
        if w[a] != w[b]:
            lead = a if w[a] > w[b] else b
            k = (s["best_of"], max(w.values()), min(w.values()))
            tally[k][0] += 1
            tally[k][1] += s["winner"] == lead

for k in sorted(tally):
    n, won = tally[k]
    print(k, n, won, round(100 * won / n, 1))   # (7, 3, 2) 117 80 68.4
The chart is charts/chart_series_states.py. It recomputes every number in this article from the bundled file at run time, including the coin and records columns, the home edge, the venue splits, the comeback lists and the 2026 figures, and asserts each one before drawing.
Sources & Further Reading
- Retrosheet postseason game logs: World Series 1903–2025, League Championship Series 1969–2025, Division Series 1981 and 1995–2025, Wild Card 2012–2025. The information used here was obtained free of charge from and is copyrighted by Retrosheet. Interested parties may contact Retrosheet at www.retrosheet.org.
- MLB Stats API: every postseason game 1903–2026 and every club’s regular-season record, retrieved 2026-10-08, 2026 games through October 7. The 2026 records match the frozen final standings in
data_layer/mlb_2026_standings.json. - The log5 formula is Bill James’s (1981 Baseball Abstract); background at SABR. Season results are cross-checkable at Baseball-Reference.
- Built by
data_layer/build_postseason_series_1903_2026.py; every figure is recomputed and checked bycharts/chart_series_states.py.