Every year around now, a team gets hot and the framing arrives with it. Nobody wants to play them. They’re peaking at the right time. They’re a different club than the one that spent July losing to the Rockies. That story rarely survives contact with a spreadsheet, so this piece builds the spreadsheet: every playoff team from 2010 through 2025, its record over its final 20 and final 30 regular-season games and over calendar September, matched against what actually happened to it in October.
Here is the whole finding in one line. Across 139 postseason series, the team that finished the regular season hotter won 72 of the 123 series where one of them clearly was — 58.5%, which sounds like something until you notice that full-season run differential does the same job at 58.0%, that the effect vanishes if you widen the window by ten games, and that the 21 teams who entered October as the hottest club in their field have won exactly one World Series between them.
What 139 series actually say
The sample is 2010 through 2025 with 2020 removed, because a 60-game season and a 16-team bracket break every comparison in the piece. The 2020 rows are in the dataset and folding them back in nudges the headline number from 58.5% to 59.7% and the run-differential row from 58.0% to 59.5%, changing no conclusion — we mention it so nobody assumes the exclusion is doing work. That leaves 15 seasons, 154 playoff team-seasons, and 139 series across four bracket formats: eight teams through 2011, ten through 2021, twelve since 2022.
For each series we asked a stupid, useful question: of the two clubs, which one looked better on a given yardstick, and did it win? Ties (two teams with identical final-20 records, for instance) are dropped rather than broken, which is why the denominators differ by row.
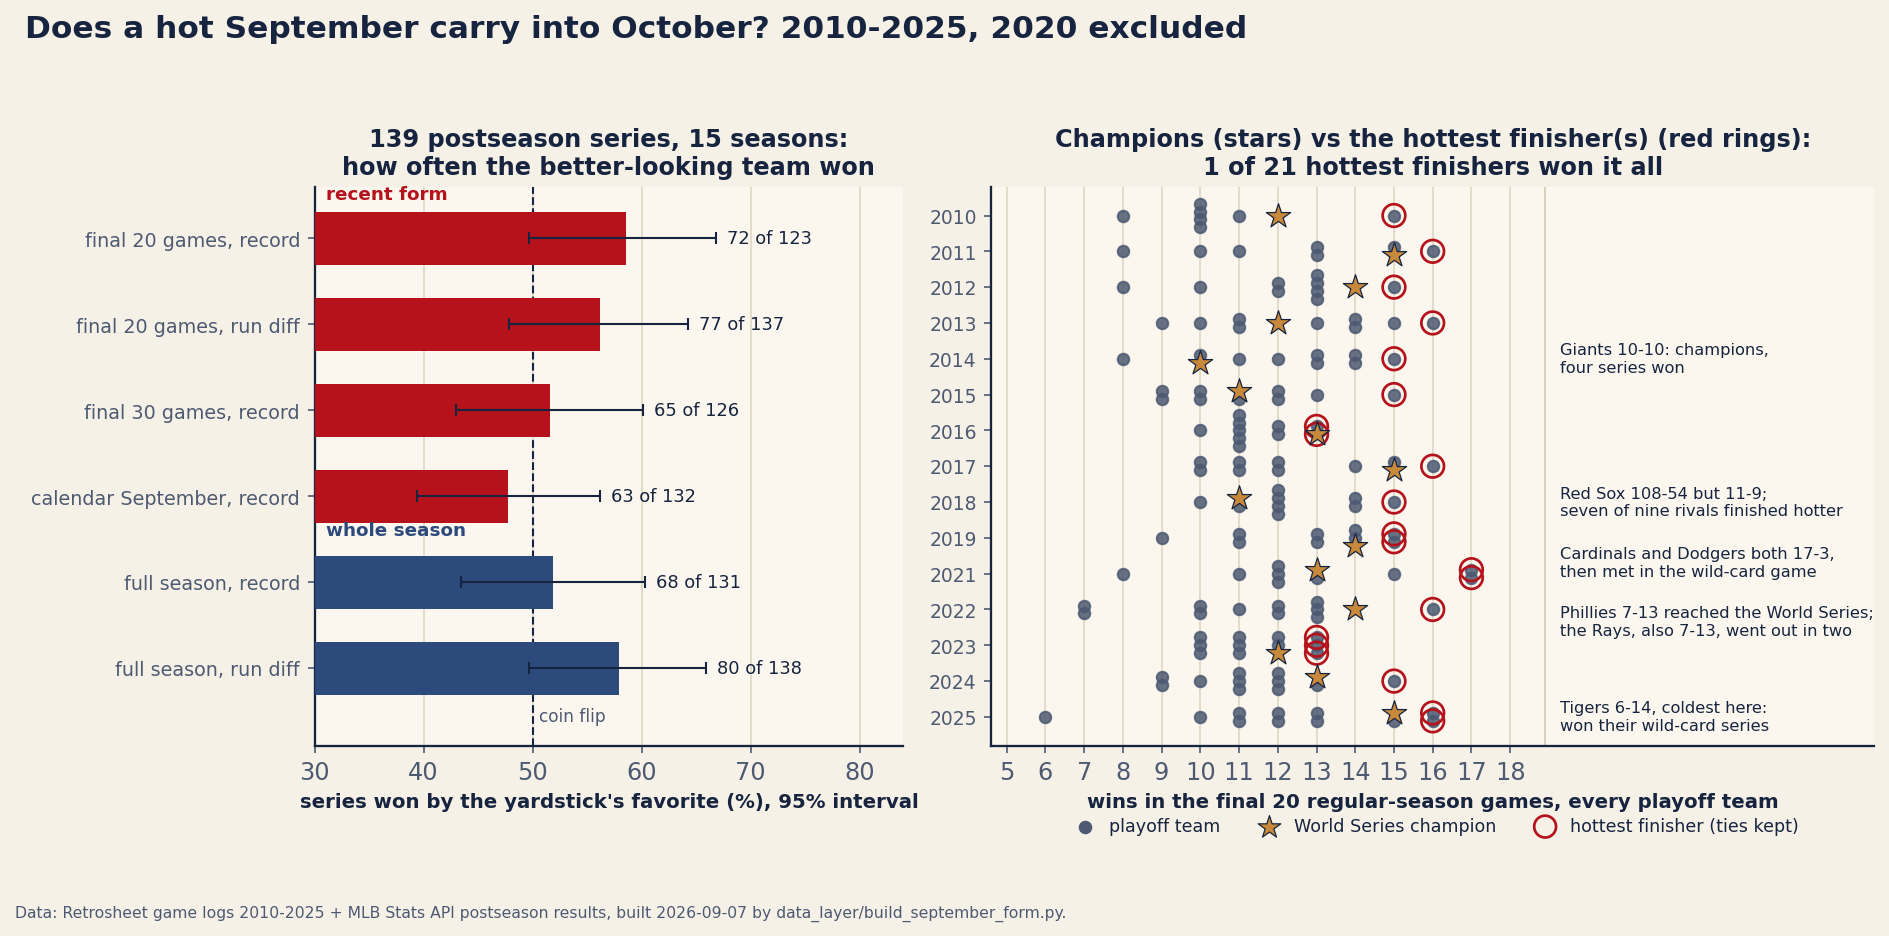
Read the left panel top to bottom and the shape of the thing appears. Final-20 record: 72 of 123, 58.5%, with a 95% interval running from 49.7% to 66.9% — it does not quite clear a coin flip, at an exact two-sided binomial p of 0.071. Final-20 run differential: 77 of 137, 56.2%. Final 30 games: 65 of 126, 51.6%. Calendar September, the version everyone actually argues about on television: 63 of 132, 47.7%, the one bar sitting on the wrong side of the line. And full-season run differential, which knows nothing about when anything happened: 80 of 138, 58.0%, statistically indistinguishable from the hot-hand row above it.
A real effect does not behave like that. If clubs genuinely arrive in October carrying momentum, a 30-game window should see it more clearly than a 20-game window, not less, and a calendar month should see it at all. What we are looking at instead is the signature of a noisy measurement that happens to land well at one width.
Separating hot from good
The obvious objection is that hot teams are also good teams, so the 58.5% might just be quality wearing a costume. Among playoff clubs the two correlate at r = +0.26, so the costume is real but loose. The clean test is to isolate the series where the two yardsticks point at different dugouts.
When the hotter finisher was not the team with the better full-season record, the hot team won 26 of 43, 60.5% — the one result in this piece that flatters momentum, though at n = 43 its interval runs from 45.6% to 73.6% and it is not close to significant. But this site’s standing position is that run differential describes a team better than its record does, so run the same test against that instead. When the hotter finisher disagreed with the better full-season run differential, hot won 26 of 49: 53.1%. Nothing. The apparent edge of form over the season is mostly an edge over a weak measure of the season, which is a different and much smaller claim.
At the team level the correlations tell the same story quietly. A playoff team’s final-20 winning percentage correlates with the number of postseason series it goes on to win at r = +0.137 (95% interval −0.022 to +0.289, so zero is still on the table). Full-season winning percentage manages r = −0.007, which is our favorite number in the dataset: among teams good enough to reach October, the regular-season standings are worth precisely nothing.
What a 15–5 finish is actually worth
The honest way to price recent form is to ask how much of a 20-game record is signal. Across all 450 team-seasons in the sample, full-season winning percentage has a standard deviation of .0759. A 162-game record carries binomial noise of √(.25/162) = .0393 even if every team were identical, so the spread of real talent is √(.0759² − .0393²) = .0650. Over 20 games the noise term balloons to √(.25/20) = .1118, and the share of a 20-game record that is signal is:
So take a .580 club — a 94-win team, roughly the middle of a playoff field — that finishes 15–5. Its true quality estimate moves from .580 to .580 + 0.253 × (.750 − .580) = .623. The hottest month available to a good team buys about four percentage points of estimated quality. Push that through Bill James’ log5 against a .580 opponent and the per-game edge is .545, which compounds to 58.3% in a best-of-five and 59.7% in a best-of-seven.
Now look back at the observed number. The hotter finisher won 58.5% of its series; treat that as a five-game series rate and it implies a per-game edge of .546, one thousandth off the .545 that regression to the mean predicts from first principles. That reconciliation is not exact — the 123 series mix one-game play-ins with best-of-sevens — but it is close enough to make the point. There is no residue left over for momentum to explain. The hot team’s edge is what a 20-game sample of a slightly-better-than-you-thought team is worth, and nothing more.
Why October’s hot teams look so convincing
If the effect is this small, why does everyone see it? Because the October field is selected on the thing being measured. A team four games out on September 1 that goes 6–14 is not in the bracket to be counted; a team that goes 15–5 is. Among the 154 playoff teams here, mean final-20 winning percentage is .602 against a mean full-season mark of .579 — the field arrives hotter than it is.
The size of the skew is checkable. If each playoff team’s last 20 games were a coin-weighted draw at its own season-long rate, you would expect 15.4 of them to finish 15–5 or better; 24 did. You would expect 49.0 to limp in at 10–10 or worse; only 36 did. Nearly everyone in October finished hot, so “the hot team won” is a sentence that will be true most Octobers no matter what is or isn’t real. It is worth remembering how ordinary a 15–5 stretch is for a good team in the first place: a true .580 club runs one off in 9.2% of any given 20 games, and even a .500 club does it 2.1% of the time. Over a six-month season, everybody gets a turn.
The gradient that survives all this is modest and mostly quality. Playoff teams that finished 14–6 or better (36 of them) won their first series 24 times, 67%, and went 180–152 in postseason games. Teams that finished 10–10 or worse (also 36) won their first series 14 times, 39%, and went 102–116. That is a real difference. It is also 1 championship from the cold group and 6 from the hot group, out of 15 — and the middle band, the 82 teams that finished between 11 and 13 wins, produced 8 of them. Champions look startlingly average on this axis: mean 12.9 wins in their final 20, median 13, against a field mean of 12.0.
The cases both sides will cite
The best argument for momentum is the 2011 Cardinals, who went 15–5 to steal a wild card on the last day and won the World Series at 90–72. The trouble is the team they beat in it: the 2011 Rangers, 96–66 with a 16–4 finish, the hottest club in that field. Someone hot was going to win that series. 2017 and 2025 offer the same shape — both champions closed 15–5 — and 2016 is the one clean case in fifteen years, the Cubs finishing 13–7 as co-hottest team in the field and best record in baseball, then winning it all.
The other column is longer. The 2021 Cardinals closed 17–3, outscoring people by 54 runs, and were eliminated in a single game by the Dodgers, who had also closed 17–3; the year’s two hottest teams drew each other in a one-game play-in, and one of them was finished before the division series began. Cleveland finished 16–4 in 2013 and lost the wild-card game, then 16–4 in 2017 at 102–60 and lost the division series. In 2023 the three co-hottest teams — Dodgers, Brewers, Rays, all 13–7 — lost their first series, all three. Last October, Seattle closed 16–4 and lost the LCS while Cleveland closed 16–4 and went out in the wild-card round.
And the cold teams keep refusing to die. The 2022 Phillies backed into the bracket at 87–75 having gone 7–13 and been outscored by 17 runs down the stretch, then won three series and reached the World Series — while the 2022 Rays, also 7–13, went out in two games, which is the variance of it. The 2015 Royals were 11–9 over their last 20, 14–16 over their last 30 and 15–17 in September, and won the World Series. The 2018 Red Sox went 108–54 and closed 11–9, with seven of the other nine playoff teams finishing hotter, and then lost three games in the entire postseason. The 2014 Giants finished exactly 10–10, won four series, and are the only champion in the sample to enter October at .500 or worse over its final 20. And the coldest club in fifteen years of playoff teams, the 2025 Tigers at 6–14, won its wild-card series and took the eventual division-series winner to five games.
2026, as of September 7
With 2,154 games played and 276 to go, the hottest team in baseball is the Phillies at 15–5 over their last 20, plus 35 runs, the only club in the majors above 14 wins in that window. They are also 80–63 and five games back of the Braves in the NL East, a race whose remaining head-to-head games matter considerably more to them than the shape of their last three weeks. Everything above says the streak is worth about four points of true-talent estimate and roughly one extra win in a five-game series, which is real and is not five games in the standings.
The rest of the board is a decent advertisement for ignoring form. All six division leaders sit between 10–10 and 12–8 over their last 20: the Brewers still own the best record at 88–56 while going 12–8, and the Rays lead the AL East at 85–58 having been outscored over their last 20 at 11–9. Coldest in the sport are the Tigers at 5–15, which by the 2025 precedent means nothing at all about what they would do if they got in. Nobody is peaking. Nobody usually is.
Limitations, stated plainly
The honest weaknesses first. At 123 to 139 decided series, this sample cannot resolve small effects: a genuine three-point edge would be invisible here, and we are not claiming momentum is exactly zero, only that it is smaller than the language around it and inside the noise of fifteen years of Octobers. The two-sided p on the headline 58.5% is 0.071, which is a result we would not publish as a finding if it pointed the other way, so we will not pretend it is one now.
Second, the final-20 window is contaminated by the thing it is trying to measure. Teams that clinch early rest regulars and hand starts to September call-ups, so their last two weeks understate them; teams fighting for their lives run their best arms out on short rest, so their last two weeks overstate them. That confound biases against the hot-hand story exactly where it matters, and we have not corrected for it, because any correction would need a lineup-strength model we do not have on disk. Read the cold-team results with that in mind — some of those 8–12 finishes were teams with nothing to play for.
Third, the bracket changed twice inside the window. Since 2022 the top two seeds per league skip the wild-card round, which hands rested teams an advantage that has nothing to do with form and a layoff that some people insist hurts. In the four bye-era seasons the rested team has won 9 of 16 division series and the hotter team 7 of 15, both of which are coin flips wearing serious expressions. And “hotter” here is only ever a team’s own recent record; we have not adjusted those 20 games for opponent quality, so a club that closed against three cellar teams is credited the same as one that closed against contenders.
Finally, none of this speaks to injuries, or to a rotation that has genuinely reorganized itself in August, or to a rookie who arrived in July and changed a lineup. Those are real, they are sometimes what a hot streak is actually made of, and a won-lost record over 20 games is a terrible instrument for detecting them. Our claim is narrower than “momentum is fake”: the 20-game record on its own does not tell you which teams have that going on.
The bottom line
September form is worth about a quarter of what it looks like, which is what regression to the mean says a 20-game sample is worth, and the numbers come out where the arithmetic says they should. A hot finish is a small upgrade to your estimate of a team, not a state the team has entered. If you want a yardstick that predicted October about as well as anything here, the whole-season run differential you already had in August did it at 58.0%, and it does not need a narrative.
The reason this keeps getting rediscovered every autumn is that October always produces a hot team who wins, because almost everyone in the field finished hot. That is a selection effect with a broadcast graphic attached. The best regular-season team still loses in October most years, and the reason is short series, not the calendar.
Reproduce it
The dataset is data_layer/september_form_2010_2025.json, built by data_layer/build_september_form.py. It reads the cached Retrosheet regular-season game logs for 2010–2025, cuts each club’s final 20 and final 30 decisions by its own game number, and hard-asserts the reconstructed W–L against the MLB Stats API’s official standings for all 30 teams in all 16 seasons — if a single record disagreed, the build would fail rather than write. Postseason results come from the same API’s schedule endpoint by gameType (F, D, L, W), grouped into series with the clinching-win count and the per-season series count asserted against each era’s format. The live 2026 figures come from two frozen files: mlb_2026_standings_2026-09-07.json and late_form_2026_2026-09-07.json, the latter built from the schedule feed and validated club-by-club against the former for both records and runs.
The chart script charts/chart_september_form.py is also the verification harness: it recomputes every figure in this piece from those files and asserts each one, 100 checks in all — the series tallies, the Wilson intervals, the binomial p, the correlations, the hot and cold bands, every named team’s record and October result, the reliability arithmetic and the log5 series math. The 2010–2025 half is frozen history and will not move; the 2026 half is pinned to dated snapshots rather than the live standings file, so this article cannot silently rot as the season finishes.
Sources & Further Reading
- Retrosheet — regular-season game logs, 2010–2025, the source for every record and window here. The information used here was obtained free of charge from and is copyrighted by Retrosheet.
- MLB Stats API — standings (used to validate every parsed record), postseason schedules by game type, and the 2026 season to date; retrieved 2026-09-07.
- Why the Best Team Loses in October — the companion argument: short series, not the calendar, are what beat good teams.
- Regression to the Mean, Explained — the reliability arithmetic used to price a 20-game record.
- Is Beating Your Run Differential a Skill? — the same placebo test applied to timing luck.
- The 2026 Playoff Races, Priced — how far variance alone can move a September race.
- The Playoff Bar — what the seat these teams are chasing actually costs.