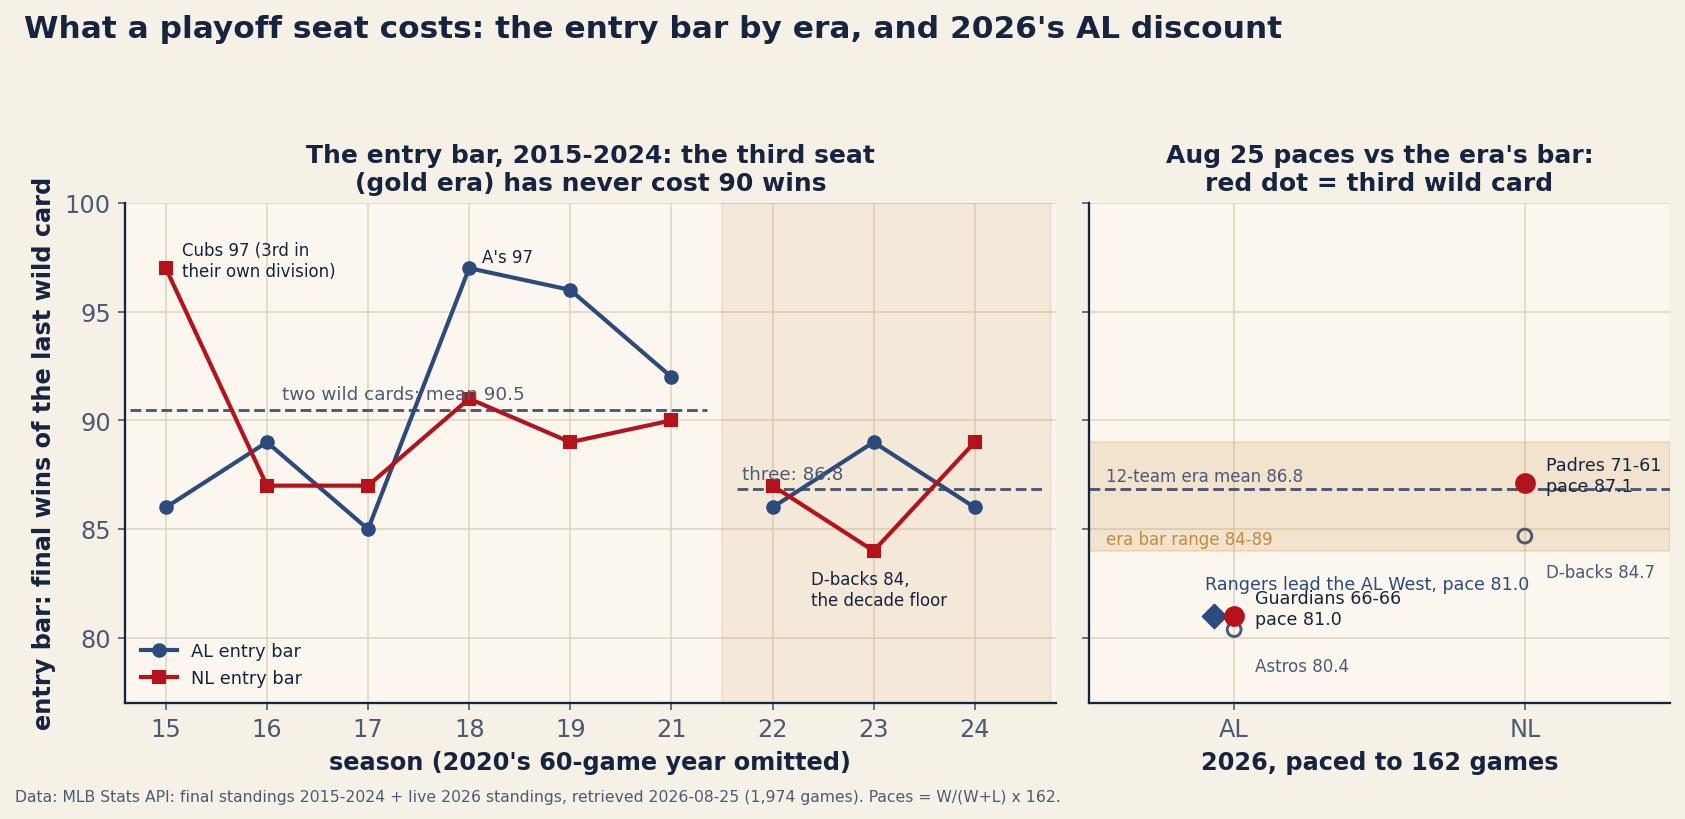
Ask what a playoff spot costs and most fans will quote you a number from a dead era: 90 wins, the old rule of thumb. It was a good rule — across the twelve league-seasons of the two-wild-card format in our bundled finals (2015–2019 and 2021), the last seat in a league cost an average of 90.5 wins, and half of those twelve entry bars sat at 90 or higher. Then 2022 added a third wild card, and the sticker price quietly collapsed: across the six league-seasons since, the bar has averaged 86.8 wins and has never once reached 90. The rule of thumb is 3.7 wins out of date.
That’s the durable finding. The perishable one is what 2026 is doing to the discount as of August 25, with 1,974 games played: the National League’s last seat is pacing to 87 wins — almost exactly the new normal — while the American League’s is held by a .500 team pacing to 81, three wins beneath the cheapest seat sold anywhere in the decade. The AL isn’t running a crowded race so much as a clearance sale, and its West division leader is no dearer: the Rangers are 66–66 too, on the identical 81-win pace.
Pricing the seat honestly
The method takes one paragraph. From the site’s bundled final standings for the nine full seasons 2015–2024 (2020’s 60-game sprint is excluded), each league-season’s postseason field is rebuilt from the records alone: best record in each division wins it, and the best remaining records take the wild cards — two per league through 2021, three since 2022. The entry bar is the win total of the last wild card in; the first out is the next team down. Records can’t see tiebreakers, but they don’t need to: when two teams tie atop a division (the 101-win Braves and Mets of 2022, the 90-win Astros and Rangers of 2023), both are in the field either way, and the code verifies the bar doesn’t move whichever club you hand the banner. League membership joins on team ID from the live 2026 file — the 30-team alignment hasn’t changed since 2013.
Two eras, two prices
The two-wild-card years were expensive and wildly volatile. The twelve bars ran from 85 (the 2017 AL, where the Twins slipped in) to 97 — twice: the 2018 A’s needed 97 wins for the right to a coin-flip game, and the 2015 Cubs won 97 while finishing third in their own division, baseball’s standing reminder that a league’s bar is really a fact about where its good teams happen to cluster. The 2019 AL seat cost 96; the 93-win Indians stayed home. Since 2022 that whole range has compressed to 84–89: six league-seasons, and not one bar reached 90. The floor was the 2023 NL, where 84 wins let the Diamondbacks in — and they went to the World Series, which is a different article’s argument about what October does to seeds.
charts/chart_playoff_entry_bar.py.Most of the discount isn’t the extra seat
Here is the part the “of course the bar fell, they added a seat” shrug gets wrong. Recompute the old bar — the second wild card’s win total — inside the 2022–2024 seasons and it averages 88.0. So of the 3.7-win drop from 90.5, only 1.2 wins came from moving one seat down the standings; the other 2.5 came from the same seat getting cheaper — the league’s win distribution flattening underneath the format change. The middle of a modern league is dense: seats five and six sit barely a win apart. That density shows up where it hurts, in the margin of elimination. In the two-wild-card years the gap between the last team in and the first team out averaged 4.0 wins (in 2015 the NL’s was thirteen). In the three-wild-card years it averages 1.2, and five of the six cut lines were settled by one win or none at all. The extreme was 2024’s NL: three teams finished 89–73 for two seats, and Arizona stayed home on a tiebreaker — a season decided by arithmetic the standings page doesn’t even display, which is why the clinch-countdown piece bothers computing the interlocks exactly.
The cheapest ticket is sometimes a banner
One quirk the bar keeps exposing: the cheapest seat in a league isn’t always a wild card. In five of the eighteen league-seasons, the lowest win total in the field belonged to a division champion — most nakedly the 2023 AL, where the Twins took the Central at 87 wins while the league’s wild-card bar sat at 89. The 91-win Guardians of 2018 and the 88-win Braves of 2021 bought October the same way: through a soft division’s side door. Which brings us to the 2026 American League, currently building the softest side door of the decade.
2026 against the decade, as of August 25
Snapshot the live standings — the same file that then fed the 2026 season page — and pace every relevant club to 162 games. A pace is just W ÷ (W+L) × 162: the Guardians, holders of the AL’s third wild card at 66–66, are .500, and .500 × 162 is 81.0. The table prices each cheap seat against the 86.8-win era average:
| Seat | Holder | W–L | Run diff | Pace | vs 86.8 |
|---|---|---|---|---|---|
| NL wild card 3 | Padres | 71–61 | +15 | 87.1 | +0.3 |
| NL first out | D-backs | 69–63 | — | 84.7 | −2.1 |
| AL Central lead | White Sox | 68–63 | +34 | 84.1 | −2.7 |
| AL wild card 3 | Guardians | 66–66 | −7 | 81.0 | −5.8 |
| AL West lead | Rangers | 66–66 | −37 | 81.0 | −5.8 |
| AL first out | Astros | 65–66 | — | 80.4 | −6.4 |
The National League is a normal market: the Padres pace within a third of a win of the era average, only one chaser (Arizona) sits within three games, and the weakest NL division leader — Atlanta — paces to 94. The American League is the anomaly, and it’s two anomalies stacked. Its top two wild cards are fine (Yankees pacing 92.2, Red Sox 89.0); the collapse is entirely at the floor. The last seat’s 81-win pace sits under every bar in the nine-season sample — three below even the 2023 D-backs’ 84 — and five teams sit within three games of it, precisely because the seat asks so little. The seat is also churning: the Twins held it when the playoff-races piece priced these gaps on August 20, and five days later they’re two games back of it. Meanwhile the Rangers lead the AL West at 66–66 while being outscored by 37 runs; at their current pace a full-season division champion would finish 81–81, under the 2005 Padres’ 82–80, the cheapest on record. For the Guardians to merely reach the decade’s floor of 84 wins, they’d have to go 18–12 the rest of the way — a .600 finish just to be as cheap as the cheapest seat ever sold. The honest reading isn’t that six teams are fighting for the AL’s last seat; it’s that none of them has been good enough to raise its price.
What a pace is not
Four limits, stated plainly. First, a straight-line pace is not a forecast: half-season records regress toward .500, winners hardest, so the true expected bar sits somewhat above today’s laggard paces — the gravity-well piece measured exactly that pull, and the remaining slate tilts each pace a little too (quantified here). Second, the field-rebuild ignores tiebreakers; that never moves a bar’s height in this sample, but it means the method names the wrong 89-win team in a 2024-style pile. Third, the 12-team era is six league-seasons old — a mean of 86.8 carries real uncertainty, and one 97-win-style outlier year would drag it. Fourth, the bar is downstream of league shape: the parity check found 2026’s standings historically compressed, and a compressed league is precisely one whose sixth seat drifts toward 81–81. The low bar and the tight standings aren’t two stories; they’re one distribution viewed from its middle.
The bottom line
Update the rule of thumb: October’s list price is 87 wins now, not 90 — the range since 2022 is 84 to 89 — and most of that discount came from the league’s middle thickening rather than from the third seat itself. Against that decade of prices, 2026 splits cleanly: the NL’s last seat is trading at par, and the AL’s is pacing to undercut every seat in the sample, with a division title in the West pacing cheaper than any full-season banner on record. Whether somebody in that five-team scrum plays well enough down the stretch to drag the bar back into the historical band is, as of August 25, the most interesting open number in the sport — and it decays daily, which is why every figure above is pinned to the snapshot date and recomputed from the files at build.
Reproduce it
Both inputs ship in the site’s data_layer/ (provenance in data_layer/SOURCE.txt); the whole computation is a sort:
import json

hist = json.load(open("data_layer/standings_2015_2024.json", encoding="utf-8"))
live = json.load(open("data_layer/mlb_2026_standings_2026-08-25.json", encoding="utf-8"))
lgdiv = {t["team_id"]: (t["league"], t["division"]) for t in live["teams"]}
WC = {2022: 3, 2023: 3, 2024: 3}  # every earlier season: 2

for season in (2015, 2016, 2017, 2018, 2019, 2021, 2022, 2023, 2024):
    for lg in ("AL", "NL"):
        ts = [dict(t, div=lgdiv[t["team_id"]][1]) for t in hist["teams"]
              if t["season"] == season and lgdiv[t["team_id"]][0] == lg]
        winners = {max((t for t in ts if t["div"] == d), key=lambda t: t["winpct"])["team_id"]
                   for d in {t["div"] for t in ts}}
        field = sorted((t for t in ts if t["team_id"] not in winners),
                       key=lambda t: -t["winpct"])
        n = WC.get(season, 2)
        print(season, lg, "bar =", field[n - 1]["W"], "first out =", field[n]["W"])

# 2026 paces: W / (W + L) * 162 from the live file
# Guardians 66-66 -> 81.0;  Padres 71-61 -> 87.1
The chart is charts/chart_playoff_entry_bar.py: it recomputes every published number from the two JSONs at run time, hard-asserts the historical facts (era means 90.5 and 86.8, the 84–89 range, the 88.0 old-bar decomposition, the 2024 three-way 89-win tie, the division-top-tie invariance), and re-derives every 2026 pace from the frozen August 25 copy, so the ladder stays pinned to the snapshot the prose describes.
Sources & Further Reading
- Final regular-season standings 2015–2024 and the live 2026 standings: MLB Stats API, bundled as
data_layer/standings_2015_2024.jsonanddata_layer/mlb_2026_standings_2026-08-25.json— a frozen, dated copy of the live standings file, served alongside it so these figures stay checkable after the next refresh (retrieved 2026-08-25; 1,974 games played). - The postseason formats behind the seat counts — two wild cards per league 2012–2021, three since 2022, with all ties broken mathematically (no game 163) from 2022 on: MLB.com, public record. Historical anchors (the 2005 Padres’ 82–80 division title, the 2023 Diamondbacks’ pennant): Baseball-Reference.
- The house pieces this one leans on: the 2026 races, priced, the magic number, explained, and the 2026 parity check.