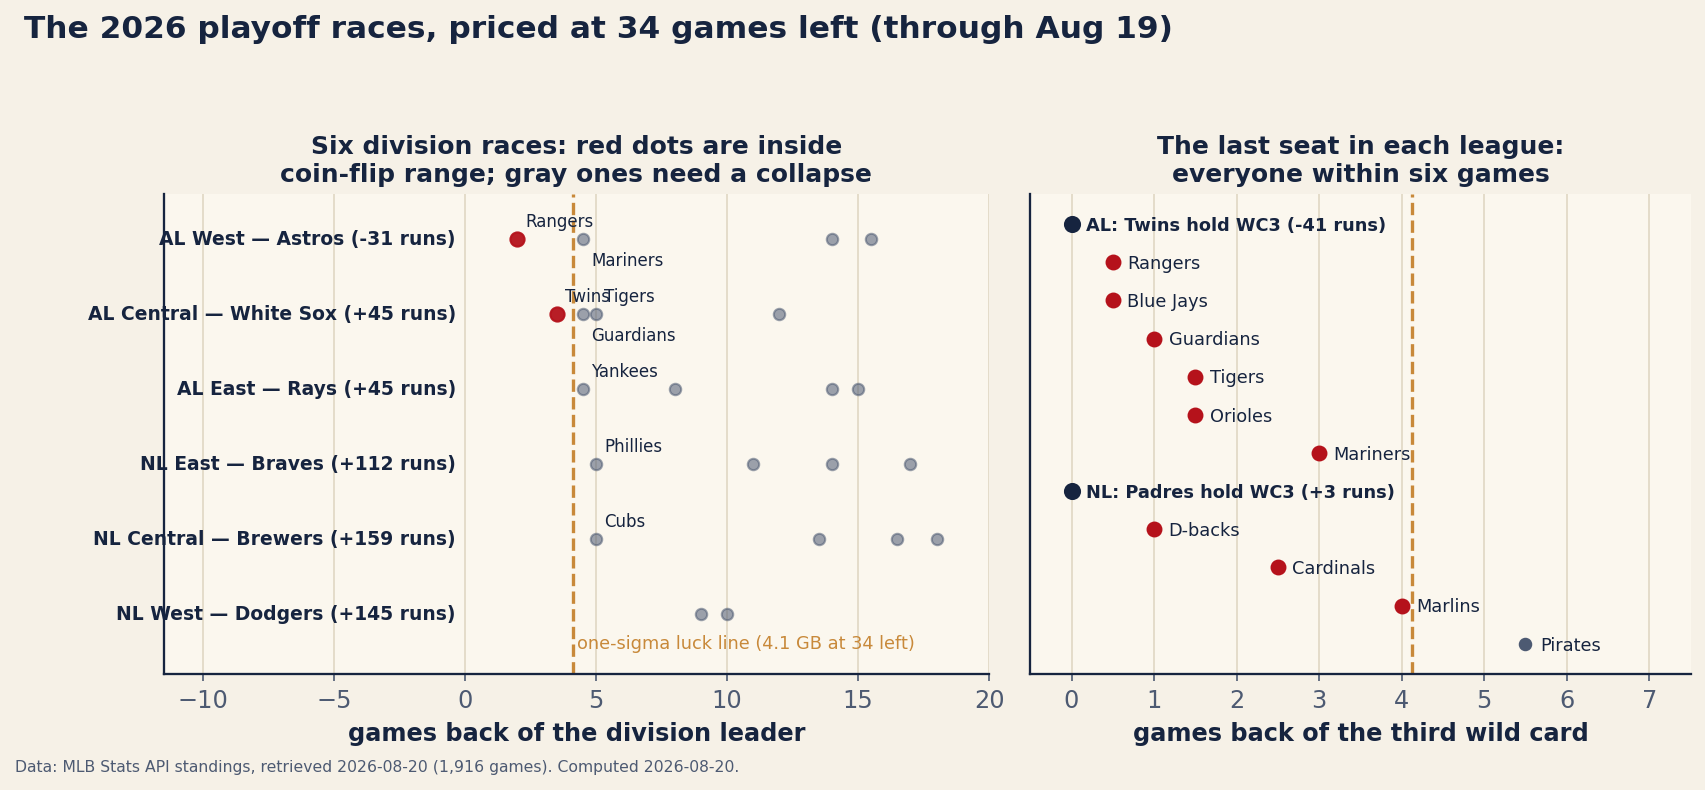
With 34 games left per team (1,916 played through August 19), every “race” in baseball can be priced with one honest yardstick: how many games of ground can pure luck still move? Over 34 games between two evenly matched teams, the answer is a standard deviation of about 4.1 games. Gaps inside that line are coin-flip recoverable; gaps just outside it need the chaser to actually be better; gaps in double digits need a collapse. Run all eight playoff-relevant races through that filter and 2026 splits cleanly: the American League has all three live division races and the National League has none — while the last wild-card seat in each league is a pile-up, including an AL scrap in which the current holder has been outscored by 41 runs.
The yardstick, stated honestly
Two equal teams playing 34 games each drift apart by luck alone with a standard deviation of √(2 × 34 × 0.25) ≈ 4.1 games. That assumes evenly matched clubs and independent games — both simplifications, both stated — but it turns “is this a race?” from a vibe into a threshold. A 2-game lead is nothing. A 5-game lead with 34 left is just past one sigma: the chaser needs to genuinely outplay the leader, not merely get lucky. Nine back is a eulogy. (The mechanics of how these leads become clinches — the magic numbers themselves — live in the countdown piece from Monday; this is the companion question of which countdowns anyone should watch.)
The American League is where the races are
AL West: Astros 64-63, Rangers 2.0 back, Mariners 4.5. The closest division race in baseball is also its strangest: the Astros lead it while being outscored by 31 runs, and the Rangers chase at −48. By run-differential logic this is a contest between two teams playing below their records’ pretensions — which is precisely why it should stay close. Nobody here has the underlying quality to run away.
AL Central: White Sox 66-61, Twins 3.5 back, Guardians 4.5, Tigers 5.0. The White Sox holding a division lead in late August is 2026’s quietest shock, and the pack behind them all sits at or inside the luck line. The most interesting team is the one the standings bury: Detroit, five back, has outscored opponents by 82 runs — the AL Central’s best run differential by a mile from fourth place. The runs say the best team in this division is currently trailing three worse ones. If margins mean anything — and this site’s standing thesis is that they mean more than records — this race has a live dark horse.
AL East: Rays 76-51, Yankees 4.5 back. Just outside the line, and flavored: Tampa Bay has banked a 76-51 record on a +45 differential while the Yankees sit at +89 — the chaser has out-margined the leader all season. The Rays’ cushion is real (their berth is close to safe; their magic number was already baseball’s smallest), but the division race specifically is one Rays cold streak from reopening.
The National League settled its divisions early
Braves +5.0 over the Phillies, Brewers +5.0 over the Cubs, Dodgers +9.0 over the Padres — and every leader owns a powerhouse differential (+112, +159, +145). These are the league’s three best teams by margin and record, each holding a gap at or past one sigma against a chaser the runs like less. Nothing is mathematically done; all of it is functionally priced. The honest reframe: the NL Central “race” is really about the first-round bye, because the Cubs (74-54, +100) are all but locked into a wild card regardless. Chicago’s five games back matter for seeding, not survival — a race about home field in October, which is a real thing worth watching and a different thing than a playoff race.
The last seat in each league
AL third wild card: Twins 63-65, then six teams within three games — Rangers and Blue Jays half a game back, Guardians one, Tigers and Orioles 1.5, Mariners three. Two things make this the best race in baseball. First, the seat is currently held by a sub-.500 team with a −41 run differential, which means it is genuinely open to whoever plays .550 ball for six weeks. Second, the pile contains Detroit (+82) and Seattle (−46) — the field’s best and nearly-worst underlying teams — so September will double as a referendum on whether margins or momentum win short races. Monday’s countdown piece flagged the Orioles as owners of the one magic number that outruns coin-flip baseball; they’ve since crept to 1.5 back. Nobody in this pile is eliminated by the yardstick; nobody is favored by it either.
NL third wild card: Padres 68-60, D-backs 1.0 back, Cardinals 2.5, Marlins 4.0, Pirates 5.5. Tighter at the top and softer underneath: the Padres hold the seat at +3 run differential, Arizona chases at +4, St. Louis at +10 — a race between teams the runs rate as almost perfectly ordinary. It will go to the wire because nothing in the underlying quality separates anyone. Miami at 64-64 is the sentimental entry, four back with a +14; the Pirates at 5.5 are past the line and need help.
The margins column, and one historic footnote
Reading the races through run differential — the house habit — produces this season’s cleanest set of disagreements between the standings and the scoreboard: Detroit (+82) is the best team not currently in the field; Minnesota (−41) is the weakest team currently in it; Houston (−31) leads a division; and the Yankees (+89) trail a +45 team by 4.5. Recent history says a fair share of these resolve toward the margins by October. And at the very bottom, a record watch with no race attached: the Athletics have been outscored by 185 runs — −1.45 per game — deep in the historic-tail territory the run-differential history piece mapped when it found the 2026 tail had flipped from the top of the league to the bottom. They are chasing infamy, not a wild card, and they are on pace to catch it.
What to actually watch through Labor Day
Three things, in order. The AL West, because a 2-game lead between two negative-differential teams is a genuine coin flip with a division attached. The AL wild-card pile, because seven teams for one seat compresses every series into leverage — and because Detroit’s margins make it the value pick lurking at 1.5 back. And the Cubs’ pursuit of the bye, the NL’s only live tension. Everything here is a snapshot through August 19; the standings will drift nightly, the yardstick won’t. When a gap crosses 4.1 with the games running out, that’s the arithmetic quietly closing a door.
Standings and run differentials from the MLB Stats API, retrieved the morning of August 20, 2026 (1,916 games played). The one-sigma yardstick assumes evenly matched teams and independent games — a deliberate simplification, priced in plain sight. Chart and every figure recomputed at build by charts/chart_playoff_races_2026.py.
The magic number, explained
This section was first published on August 17, 2026 as a separate article. Data: MLB Stats API (live 2026 standings + remaining schedule).
Around the first of September, a small number starts appearing next to the standings, and for six weeks it is the most honest number in baseball. The magic number doesn’t project or simulate; it counts, with no modeling assumptions at all, how far a leader sits from making the chase mathematically impossible. This piece builds the formula from scratch — including the two details most explanations skip, the +1 and the odd rule about what makes the number fall — and then computes every one of them from the standings and remaining-schedule files that then fed our 2026 season page, pulled the morning of August 17, 2026 with 1,870 games played and 561 left: all six division races, plus every club currently in playoff position. Eighteen numbers, two weeks before they reach the scoreboard graphics.
The headline: the smallest magic number in baseball is the Rays’ 25, and it isn’t for their division — it’s their countdown to a postseason berth, nine games ahead of their divisional number, because clinching a spot is easier than clinching the spot. At the other end of the ladder, exactly one number exceeds what coin-flip baseball can deliver: the Orioles’ 38, which is why the AL’s third wild card — six teams within 1.5 games — is the race to watch in September.
The formula, built honestly
Start from what a clinch is: the leader has clinched when the chaser’s best possible season can no longer beat the leader’s already banked one. A chaser with Wc wins and gc games left can finish with at most Wc + gc wins. The leader is safe once its banked wins strictly exceed that ceiling — strictly, which is where the +1 comes from:
The two forms are the same algebra: in a full G = 162-game season the chaser’s remaining games are 162 − Wc − Lc, and substituting collapses the first form into the textbook one. The +1 exists because matching the ceiling isn’t clinching — a tie is not a win. (Since 2022 there is no game 163; ties are broken mathematically, head-to-head record first, so a leader holding the tiebreaker is effectively safe one game early. The number computed here is the traditional unconditional one.)
Now the decrement rule, the part that trips people up. M shrinks when Wl rises (a leader win) or when the chaser’s ceiling falls — and the ceiling falls only when the chaser loses, because a chaser win just moves a game from gc to Wc and leaves the sum alone. One tick per leader win, one per chaser loss, and two when the leader beats the chaser head-to-head — one event that is both. Nothing else moves it.
A worked example: Brewers–Cubs
The NL Central, the race our remaining-schedule piece flagged as the one place the calendar still matters. As of August 17 the Brewers are 77–48, the Cubs 72–53, both with 37 to play. The Cubs’ ceiling is 72 + 37 = 109, so Milwaukee’s magic number is 109 − 77 + 1 = 33; the textbook form agrees, 163 − 77 − 53 = 33. Any mix of 33 Brewers wins and Cubs losses ends the race — and since seven of those games are head-to-head, a Milwaukee sweep of them alone would cut the number by fourteen. The same arithmetic against the other chasers gives smaller numbers (the Cardinals’ ceiling is 101, the Reds’ 98, the Pirates’ 97 — the Reds sit a game higher than the Pirates because they had played three fewer games), so the Cubs are the binding chaser: clinching means eliminating everyone, and the published number is the largest of the pairwise ones.
The ladder: every 2026 countdown
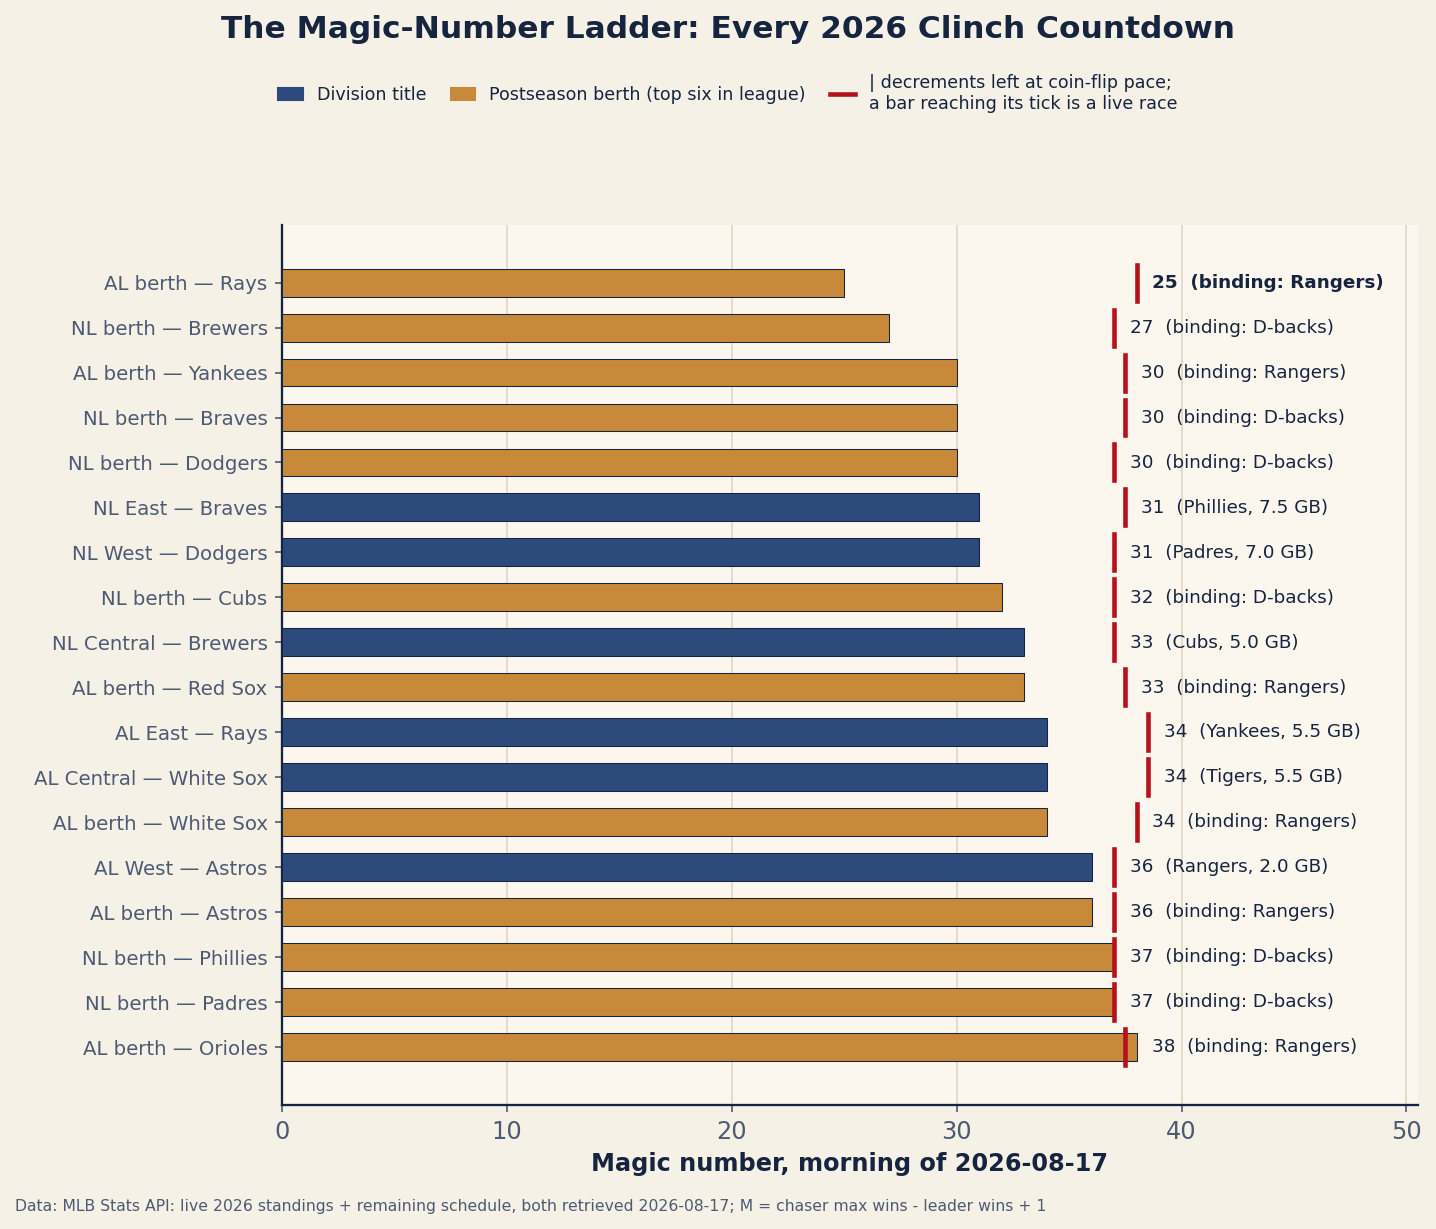
charts/chart_magic_number_ladder_2026.py.Reading the ladder takes one derived number. Every leader win and chaser loss cuts M by one, so if both clubs play .500 ball the expected decrements left are (gl + gc) / 2 — about 37 to 38.5 for every race right now. Call that the coin-flip budget. A number comfortably under its budget is a race that ends on schedule unless the chaser outplays the leader from here; a number at or past it is a genuine fight. That line splits 2026 cleanly:
| Race | Leader | W–L | Binding chaser | GB | M | Budget | Verdict |
|---|---|---|---|---|---|---|---|
| AL wild card 1 | Yankees | 69–55 | Rangers | — | 30 | 37.5 | functionally over |
| NL East | Braves | 74–50 | Phillies | 7.5 | 31 | 37.5 | functionally over |
| NL West | Dodgers | 74–51 | Padres | 7.0 | 31 | 37.0 | functionally over |
| NL wild card 1 | Cubs | 72–53 | D-backs | — | 32 | 37.0 | functionally over |
| NL Central | Brewers | 77–48 | Cubs | 5.0 | 33 | 37.0 | leaning Brewers — 7 H2H left |
| AL wild card 2 | Red Sox | 66–58 | Rangers | — | 33 | 37.5 | likely, not settled |
| AL East | Rays | 74–49 | Yankees | 5.5 | 34 | 38.5 | functionally over |
| AL Central | White Sox | 65–58 | Tigers | 5.5 | 34 | 38.5 | functionally over |
| AL West | Astros | 63–62 | Rangers | 2.0 | 36 | 37.0 | alive |
| NL wild card 2 | Phillies | 67–58 | D-backs | — | 37 | 37.0 | alive — tied with Padres |
| NL wild card 3 | Padres | 67–58 | D-backs | — | 37 | 37.0 | alive — D-backs 1 back |
| AL wild card 3 | Orioles | 61–63 | Rangers | — | 38 | 37.5 | wide open — 6 teams in 1.5 G |
Eight countdowns are bookkeeping; four are baseball. The AL West is the only live division race — Houston’s 36 against a 37-game budget means no coasting to a clinch on .500 ball, and, remarkably, the Astros and Rangers have zero head-to-head games left: the shortcut that shrinks a magic number fastest doesn’t exist there. The NL’s last two berths are a three-team knot — Phillies and Padres tied at 67–58, Arizona one back — and the AL’s third is barely a lead at all: the 61–63 Orioles, chased by the Rangers, Blue Jays, Tigers, Guardians and Twins, all within a game and a half. Note the Rangers appearing three times in the chaser column — simultaneously a division chaser and the ceiling-setter for every AL berth. Races interlock, which is why the wild-card arithmetic needs the care described below.
The division leaders run berth countdowns of their own, and they’re the fastest clocks in the sport: Rays 25, Brewers 27, Braves and Dodgers 30, White Sox 34 — and the Astros 36, identical to their division number, because in a race that tight there is no cheaper prize. That is why September’s “clinched postseason berth” banners always precede the division champagne.
Elimination numbers: the same countdown, upside down
Flip the subtraction and you get the chaser’s elimination number — the “tragic number,” in press-box usage. The mirror is exact: the same 33 that clinches for Milwaukee eliminates Chicago, decrementing on the same events. But the countdowns aren’t symmetric across a division: against Milwaukee’s 77 banked wins the Reds, ceiling 98, are 22 from divisional elimination and the Pirates, ceiling 97, are 21. League-wide, the first tragic number to watch is the Rockies’ 22: at 50–74 with an 88-win ceiling, any mix of 22 Colorado losses and wins by the NL’s sixth-place club ends their season — the likely first mathematical elimination of 2026, weeks before anyone clinches anything. The Angels (49–76, ceiling 86) are the AL’s closest at 26.
Where the magic number misleads
Three honest caveats. First, head-to-head games break the countdown intuition: each of the Brewers’ seven Cubs games moves M by two or zero, never one, so the schedule — not just the standings — decides how fast a number can fall (schedule difficulty is a different question, answered elsewhere). Second, wild-card numbers use different arithmetic: with no single opponent to eliminate, the honest computation asks when a club is guaranteed a top-six finish in its league, making the binding rival the sixth-highest remaining ceiling among the other fourteen clubs. Today that coincides with the “first team out,” but it needn’t: a second-place team falling from a division race drops into the berth pool carrying all its wins. Third, a team holds several magic numbers at once, resolving in order of ambition — the Rays are 25 from October but 34 from a division title. The magic number tells you when certainty arrives; for probability before that you want a simulation, and those models come with their own disagreements.
The bottom line
The magic number is the rare baseball statistic with no model inside — two win totals, a games-left count, and a +1 — and computed honestly it sorts 2026 into eight countdowns and four contests, with the sport’s smallest number (the Rays’ 25) attached to a berth rather than a banner and its most watchable (the Orioles’ 38) attached to a five-team pileup. This page is a dated snapshot, frozen on the morning of August 17, of numbers that decay daily by construction — that’s their whole charm. For the standings behind them, the 2026 season page re-rendered from the same data files during the season and now holds the final standings; the division-strength audit covers the question this piece deliberately doesn’t — not who will clinch, but who deserves to.
Reproduce it
Both inputs ship in the site’s data_layer/ (provenance in data_layer/SOURCE.txt), and every number above is one comprehension deep:
import json

stand = json.load(open("data_layer/mlb_2026_standings_2026-08-17.json", encoding="utf-8"))
sched = json.load(open("data_layer/remaining_schedule_2026-08-17.json", encoding="utf-8"))
left = {t["short"]: t["remaining_G"] for t in sched["teams"]}
ceil = {t["short"]: t["W"] + left[t["short"]] for t in stand["teams"]}

# division magic number: binding chaser = highest ceiling among the rivals
for lead in (t for t in stand["teams"] if t["div_leader"]):
    rivals = [t for t in stand["teams"]
              if t["division"] == lead["division"] and not t["div_leader"]]
    M = max(ceil[r["short"]] for r in rivals) - lead["W"] + 1
    print(lead["division"], lead["short"], "M =", M)

# berth magic number: guaranteed top-six in league -> 6th-best other ceiling
def berth_M(team):
    others = sorted((ceil[t["short"]] for t in stand["teams"]
                     if t["league"] == team["league"]
                     and t["short"] != team["short"]), reverse=True)
    return others[5] - team["W"] + 1

# Brewers: max(109, 101, 97, 97) - 77 + 1 = 33   (classic: 163 - 77 - 53 = 33)
# Rays berth: 98 - 74 + 1 = 25;  Yankees berth: 98 - 69 + 1 = 30
The chart is charts/chart_magic_number_ladder_2026.py; it recomputes the full ladder at run time and asserts that the classic 163 − Wl − Lc form agrees with the ceiling form for every full-schedule chaser. Point the two paths at the live mlb_2026_standings.json and remaining_schedule_2026.json instead of the frozen August 17 copies, re-run the builders, and the ladder re-prices itself.
Sources & Further Reading
- Live 2026 standings and the full remaining schedule: MLB Stats API, bundled as
data_layer/mlb_2026_standings_2026-08-17.jsonanddata_layer/remaining_schedule_2026-08-17.json— frozen, dated copies of the two live files, served alongside them so these figures stay checkable after the next refresh (both retrieved 2026-08-17; 1,870 games played, 561 remaining). - The postseason format behind the top-six arithmetic — three division winners plus three wild cards per league, all ties broken mathematically (head-to-head first) since 2022: MLB.com, public record.
- The house pieces this one leans on: the 2026 season page (final standings), remaining strength of schedule, and why playoff-odds models disagree.