In October 2007 the Colorado Rockies finished a four-game sweep of Arizona on October 15 and then waited eight days for the World Series, the longest layoff in our file. Boston beat them 13–1 in Game 1 and swept them. Every October since, a team that clinches early hears the same warning: rest turns into rust. This year’s four division winners with byes sat for five days or more before the Division Series, while the teams they played had one or two days off.
We wanted to know whether the warning holds up, so we worked out the days off each club had before 226 postseason series and checked who won. More rest has not cost anything we can measure. Across 134 series where one club had more rest, that club won 68; their regular-season records predicted 70.7. Clubs that sat five days or more won 19 of 38, against 20.1 expected. Game 1, where rust is supposed to show, gives the same answer. The rested club won 73 of 134 openers, against 70.6 expected.
How the file was built
Our postseason file has every postseason game since 1903 from the MLB Stats API, checked game by game against Retrosheet’s postseason game logs, with every club’s regular-season record. For each series we need each club’s previous game. A club that played an earlier round that October has it in the same file. A club coming straight from the regular season needs its last regular-season game, and for that we used Retrosheet’s regular-season game logs, which we have on disk for 2010 through 2025.
That sets the sample. Days off means the calendar days between a club’s previous game and Game 1, so a club that played the day before has zero. Every series from 1969 on in which both clubs came off an earlier round is in: League Championship Series and World Series, plus the rounds after the Division Series began in 1995. First-round series count from 2010. That makes 226 series from 1969 to 2025. Of those, 18 were single wild-card games, which we set aside, which leaves 208. In 74 of them both clubs had the same rest, and in 134 one club had more. Those 134 are the test.
Rest isn’t random, so a raw count would mislead. The club that waits is usually the one that swept, or the one with the best record, and it usually opens at home. To allow for that we compare each result with an expectation. Each club’s record is pulled toward .500 by 24.3%, the share of the spread in records that a season of coin flips would produce by itself (measured over 2,630 team-seasons). The two numbers are then combined with Bill James’s log5. For Game 1 we add the home edge postseason clubs have had in their own parks, 54.2% between even clubs, for whichever club hosted. The series expectation treats every game as neutral ground. The method is the same one we used for what a series lead is worth.
What 134 series say
| Group | Series | Rested club won | Share | Expected | Game 1 won | Share | Expected |
|---|---|---|---|---|---|---|---|
| All series with unequal rest | 134 | 68 | 50.7% | 52.8% | 73 | 54.5% | 52.7% |
| One more day off | 56 | 27 | 48.2% | 51.1% | 26 | 46.4% | 51.2% |
| Two more days off | 35 | 17 | 48.6% | 54.1% | 19 | 54.3% | 52.9% |
| Three more days off | 28 | 16 | 57.1% | 55.9% | 19 | 67.9% | 56.0% |
| Four to six more days off | 15 | 8 | 53.3% | 50.0% | 9 | 60.0% | 51.6% |
| Rested club sat five days or more | 38 | 19 | 50.0% | 52.8% | 19 | 50.0% | 53.3% |
| First-round bye, Division Series 2022–25 | 16 | 9 | 56.3% | 57.7% | 9 | 56.3% | 58.2% |
| Both clubs off an earlier round | 96 | 49 | 51.0% | 51.2% | 49 | 51.0% | 51.0% |
| One club off the regular season | 38 | 19 | 50.0% | 56.7% | 24 | 63.2% | 57.1% |
No row shows a pattern. Overall, the more-rested club won 50.7% of series where its record predicted 52.8%, a shortfall of 2.7 series in 134, or about half a standard error. The size of the rest edge doesn’t sort anything. Clubs with one or two extra days fell a little short, clubs with three or more did a little better, and none of these gaps is large for a group of 15 to 56 series. The cleanest row is the biggest one: in the 96 series where both clubs came off an earlier round, the rested club won 49, and its record predicted 49.2.
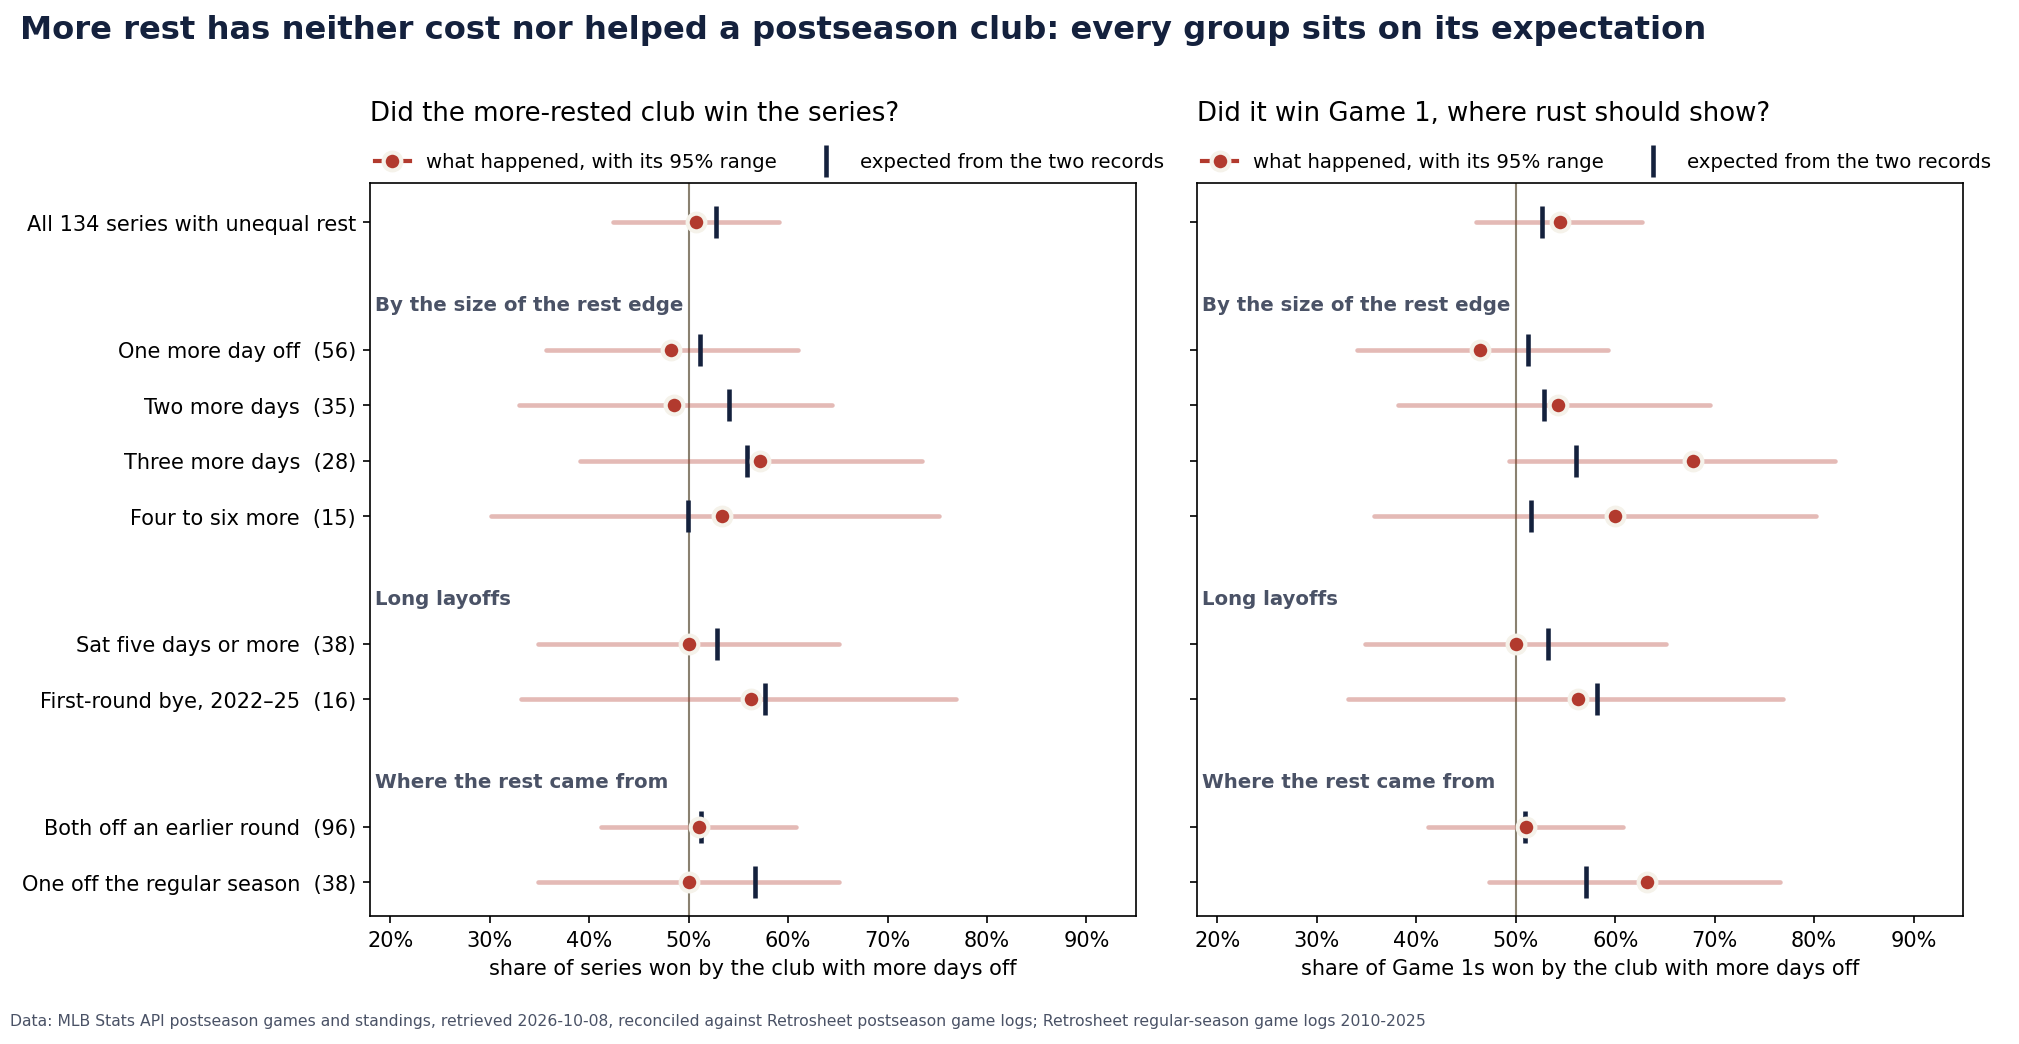
Every red range in the chart covers its tick. The widest gap is on the left, in the 38 series where one club came straight from the regular season. Those clubs won 19 where 21.5 were expected, but in the same 38 series they won 24 Game 1s against 21.7 expected. If a long wait were hurting them, Game 1 is where it should have shown, and it went the other way.
Where rust should show: Game 1
The rust argument is about timing. Hitters who have not seen live pitching for a week are supposed to be late on fastballs for a game or two. Over a full series that could wash out, so the opener is the fair place to look. In 43 series where one club had three or more extra days off, the rested club scored 4.63 runs a game in Game 1 and 3.72 in the games after. The club with less rest scored 3.91 in Game 1 and 4.03 afterwards. On this measure the rested hitters did better in the opener, not worse.
We can’t say why from this file, because it has no starting pitchers in it. One reason worth checking is that a club coming off a long series has often just used its best starters and can’t line them up for Game 1, but we have not tested that. Home field explains part of the Game 1 record. The rested club hosted the opener in 87 of the 134 series, and the Game 1 expectation already allows for that. Even with home field allowed for, the rested club still won 2.4 more openers than expected, which is too few to call an effect but the opposite of rust.
The layoffs everyone remembers
The Rockies are the case for rust, so here is what their records predicted. Colorado went 90–73 in 2007 and Boston went 96–66. Pulled toward .500, those records become .5395 and .5701, and log5 gives Colorado
That is 46.9% a game on neutral ground and 42.8% in Game 1 at Fenway Park. Over a best-of-seven, the model gave the Rockies a 43.3% chance to win the series. Losing it, even by a sweep, needed no rust to explain. Boston was the better team on the season, and Colorado’s 7–0 run through the first two rounds had not changed its record.
The other long waits split. Nine clubs in the file sat six days or more against an opponent with less rest, and six of the nine won the series: the 1995 Braves, 1996 Yankees, 2008 Phillies, 2019 Nationals, the 2024 Guardians in their Division Series and the 2025 Dodgers. The 2006 Tigers, the 2009 Phillies and the 2007 Rockies lost. The losses get remembered as rust; the wins usually get credited to a rested rotation.
The bye, four Octobers in
The 12-team format added in 2022 made long rest routine. The top two division winners in each league skip the best-of-three Wild Card Series and wait five or six days for the Division Series, while their opponents arrive with one or two days off. Bye teams won 9 of 16 Division Series from 2022 to 2025, where their records predicted 9.2. By year they went 2–2, 1–3, 3–1 and 3–1. The 1–3 in 2023, when the Orioles, Braves and Dodgers all went out, is where the rust story comes from. Four series a year is too few to read a single October. The bye teams hosted all 16 openers and won 9 of them, against 9.3 expected. Byes give a club home field and a set rotation. In four years they have not given it any measurable rust.
Through October 7, the last day in our file, 2026 followed the same pattern. The four bye teams each had five or more days off: the regular season ended September 27 and the Division Series began October 3. The Dodgers beat the Braves 3–1, the Rays swept the Yankees and the Brewers beat the Padres 3–1. The Guardians, the bye team whose record was closest to its opponent’s (85–77 against the White Sox’s 84–78), lost the first two games at home and trailed 2–1. On October 7 the bye teams were 10–4 in games and had won three of the four openers. Results after October 7 are not in this piece.
What this does not say
This does not show that rest has no effect. It shows the effect is too small to see in 134 series. The 95% range on the overall share runs from 42.4% to 59.1%, so a cost or a benefit of a few points either way fits these numbers. Rest is also tangled up with other things. A long wait usually means a sweep, which means a club that just played well, and it usually means home field. The model allows for records and home field but not for health, rotation order or the bullpen. Before 2010 only clubs coming off an earlier round are in the sample, because our regular-season game logs start in 2010. Our days-off count uses calendar days and ignores travel.
The bottom line
Clubs that waited longer have won about as often as their records said they would, in the series and in Game 1. That holds for the bye teams too. The Rockies’ eight days in 2007 are the best-known layoff in this file, and the records alone made Boston the favorite. Whether rest is worth anything to a team is still an open question. These 134 series give no sign that it costs one. This study pairs with whether a hot September carries into October, why the best team loses in October and home-field advantage.
Reproduce it
The dataset ships in the site’s data_layer/ (provenance in data_layer/SOURCE.txt). build_postseason_rest_1969_2025.py builds it offline from two files already in that folder: the postseason file of October 8 and Retrosheet’s regular-season game logs for 2010–2025. This counts the first row of the table:
import json

path = "data_layer/postseason_rest_1969_2025_2026-10-12.json"
js = json.load(open(path, encoding="utf-8"))
n = won = g1 = 0
for s in js["series"]:
    a, b = s["teams"]
    if s["best_of"] == 1 or a["days_off"] == b["days_off"]:
        continue
    rested = a if a["days_off"] > b["days_off"] else b
    n += 1
    won += s["winner"] == rested["id"]
    g1 += s["games"][0]["win"] == rested["id"]
print(n, won, g1)   # 134 68 73
The chart is charts/chart_postseason_rest.py. It rebuilds the records model and the home edge from the postseason file, computes every row, figure and 2026 result in this article, and asserts each one before it draws the chart.
Sources & Further Reading
- Retrosheet regular-season game logs 2010–2025 (last regular-season game dates) and postseason game logs (the reconciliation of every postseason game 1903–2025). The information used here was obtained free of charge from and is copyrighted by Retrosheet. Interested parties may contact Retrosheet at www.retrosheet.org.
- MLB Stats API: every postseason game and every club’s regular-season record, retrieved 2026-10-08, 2026 games through October 7; the 2026 regular season’s last games, September 27, from the frozen final standings in
data_layer/mlb_2026_standings.json. - The log5 formula is Bill James’s (1981 Baseball Abstract); background at SABR. Series results can be checked at Baseball-Reference.
- Built by
data_layer/build_postseason_rest_1969_2025.py; every figure is recomputed and checked bycharts/chart_postseason_rest.py.