In Game 2 of the National League Championship Series on October 12, the Dodgers used eight pitchers and lost 7–4 in Milwaukee. The Brewers used five. Any October box score looks like that now: a line of relievers on each side, and a broadcast graphic counting how many arms each bullpen has left. What the graphic rarely says is that the count itself is one of the better clues to who won.
We counted the pitchers each club used in every postseason game since 1903 and in every regular-season game since 2010. In the regular season the count tells you almost nothing. From 2010 through 2025, when the two clubs used different numbers of pitchers, the one that used fewer won 52.4% of the time. In the postseason over the same years it won 320 of 482 games, or 66.4%. Clubs that got through a postseason game with three pitchers or fewer won 66.5% of the time, and clubs that needed six or more won 40.9%. In the regular season those two groups won 51.7% and 48.7%.
How we counted
Retrosheet’s game logs record, for every game, how many pitchers each club used. We read their postseason logs for all 1,878 postseason games from 1903 to 2025 and matched each one to our postseason file from the MLB Stats API, which gives the round, the series and the game number. For the regular season we read Retrosheet’s logs for 2010 through 2025, the years we keep on disk: 37,343 regular-season games. The two sources agree. For 2025 the MLB Stats API’s season pitching totals add up to 20,868 appearances in 4,860 starts, and Retrosheet’s logs give the same 20,868.
For 2026 we took one boxscore from the MLB Stats API for each postseason game that was final, and the API’s regular-season totals: 20,800 appearances in 4,858 starts, or 4.28 pitchers per club per game. The study period for the main comparison is 2010 to 2025, which gives 617 postseason games to set against the regular-season logs.
October uses more arms
The first finding is the one everyone expects. Postseason clubs from 2010 to 2025 used 5,971 pitchers in 1,234 team-games, 4.84 a game, against 4.17 in the regular season. October also has more extra innings, which add pitchers, so we checked nine-inning games alone: 4.70 against 4.02. The postseason figure was higher in all 16 seasons. The gap was smallest at 0.21 in 2010 and largest at 1.06 in 2018. Under the 12-team format, from 2022 to 2025 postseason clubs used 5.03 pitchers a game against 4.27 in the regular season.
The regular-season bullpen story is a long climb and a recent pullback. October is the same story pushed further. The usual explanation is that October managers have little reason to save arms: there are off days between most games and no long season left to protect, so a starter facing the times-through-the-order penalty comes out sooner.
Who used more, and who won
The second finding is the one in the chart. Sort each club’s games by how many pitchers it used and look at how often it won.
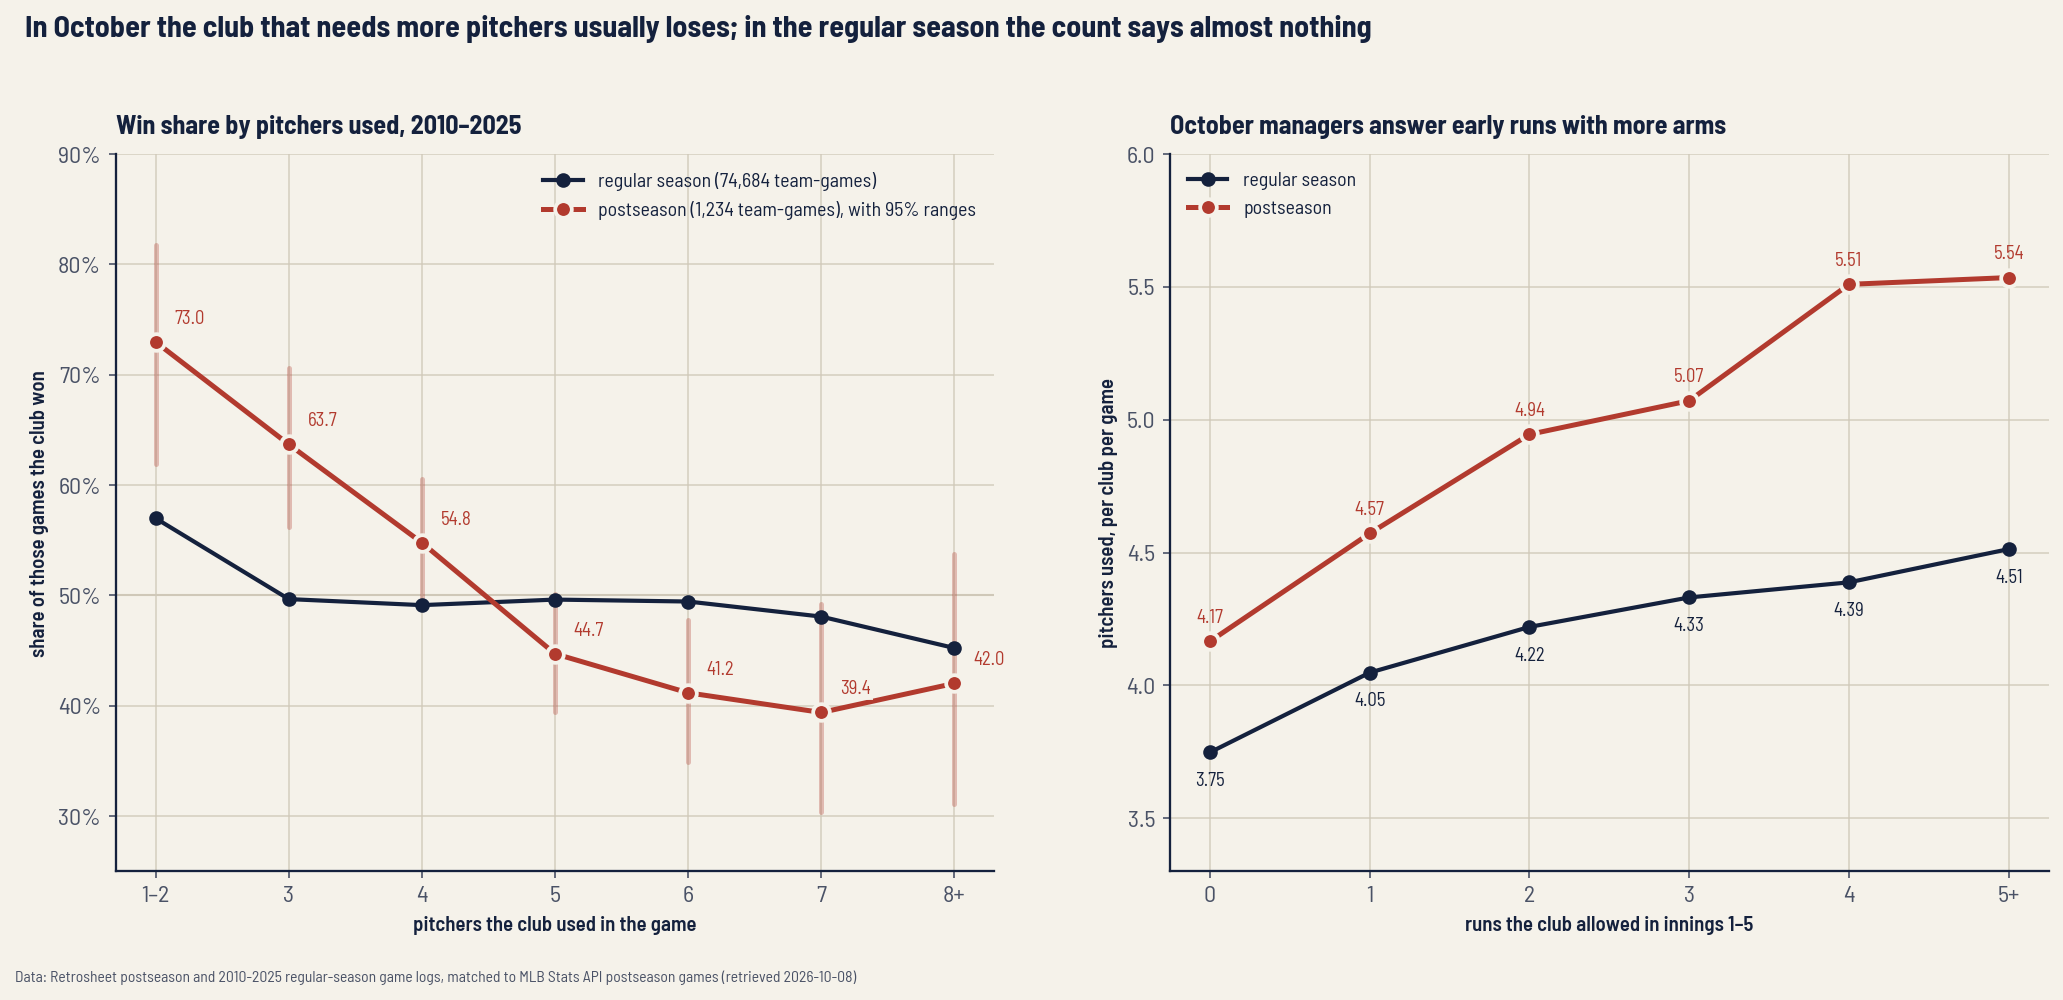
The regular-season line is nearly flat. A club that used three pitchers won 49.7% of the time and a club that used seven won 48.1%. Only the near-complete games stand out, at 57.0%. The postseason line falls steadily, from 73.0% for one or two pitchers to 39.4% for seven. Put another way, postseason winners used 4.55 pitchers a game and losers 5.13. In the regular season the two figures were 4.12 and 4.21.
Could that be chance?
A 66.4% rate in 482 games is a long way from 52.4%, but here is the arithmetic. If postseason games behaved like regular-season games, the club using fewer pitchers would have won 52.43% of the 482 games where the counts differed:
The standard deviation of that count is
and the club using fewer pitchers actually won 320, so the distance in standard deviations is
Six standard deviations is far too many for luck. Whatever the count measures, it measures something different in October.
Why the count matters only in October
The right panel offers an explanation. It groups clubs by how many runs they allowed in the first five innings, which is roughly how much trouble the starter got into. In the regular season, a club that allowed nothing through five used 3.75 pitchers and a club that allowed five or more used 4.51, a rise of 0.77 before rounding. In the postseason the same two groups used 4.17 pitchers and 5.54, a rise of 1.37. October managers answer early runs with nearly twice as many extra arms.
The early runs themselves mean the same thing in both settings. A club that allowed nothing through five won 74.3% of postseason games and 76.6% of regular-season games. A club that allowed five or more won 15.0% and 14.9%. So the game situation predicts winning the same way in both. What changes is how closely the pitcher count follows the game situation. In the regular season a pitching change is often planned, by pitch count, the rotation or a reliever’s rest day, and the club that is losing comfortably saves its good relievers. In October a pitching change usually follows trouble, so the count tracks the trouble and the trouble decides the game.
That is an explanation the data supports, not one it proves. The game logs have no innings pitched, so we can’t say when each starter left.
A century of October pitching
The pattern is older than modern bullpens. The table counts every postseason game by decade.
| Decade | Games | Pitchers per club | Complete games | Fewer-pitchers club W–L | Share |
|---|---|---|---|---|---|
| 1900s | 36 | 1.33 | 72.2% | 16–1 | 94.1% |
| 1910s | 58 | 1.48 | 62.9% | 29–5 | 85.3% |
| 1920s | 60 | 1.85 | 49.2% | 36–5 | 87.8% |
| 1930s | 54 | 1.93 | 50.0% | 36–4 | 90.0% |
| 1940s | 60 | 2.23 | 42.5% | 46–3 | 93.9% |
| 1950s | 61 | 2.34 | 32.8% | 45–4 | 91.8% |
| 1960s | 66 | 2.52 | 36.4% | 57–4 | 93.4% |
| 1970s | 140 | 2.86 | 18.2% | 87–22 | 79.8% |
| 1980s | 176 | 2.91 | 14.5% | 107–39 | 73.3% |
| 1990s | 228 | 3.70 | 6.6% | 130–59 | 68.8% |
| 2000s | 322 | 4.07 | 3.3% | 180–68 | 72.6% |
| 2010s | 356 | 4.64 | 2.2% | 190–92 | 67.4% |
| 2020s | 261 | 5.10 | 0.4% | 130–70 | 65.0% |
In the 1900s a postseason club used 1.33 pitchers a game, and 72.2% of team-games were complete games. In the 2020s it is 5.10 pitchers, and 0.4% were complete games: two, both by Yoshinobu Yamamoto in 2025, in the League Championship Series and the World Series. (The death of the complete game covers the regular-season version.) The club with fewer pitchers won more often in every decade. From 1903 to 2009 it won 769 of 983 games, 78.2%. When a starter almost always finished, a second pitcher meant something had gone badly wrong. The signal has weakened as relievers became routine, but it hasn’t gone away.
Elimination games are not all hands on deck
If any game should bring out every arm, it is the one a club can’t lose. The counts barely move. From 2010 to 2025 a club facing elimination used 4.88 pitchers in 300 team-games, against 4.83 in the other 934. In the 65 winner-take-all games, 18 of them single wild-card games, each club used 4.87. The fewer-pitchers rule held in them too: when the counts differed, the club with fewer won 44 and lost 11. If facing elimination changes how a manager handles his staff, the counts don’t show it. They can’t show which relievers he chose.
2026 so far
Through 8:41 p.m. Eastern on October 15, when we pulled the boxscores, 31 games of this postseason were final, and NLCS Game 4 in Los Angeles was in progress and is not counted. Clubs have used 304 pitchers in 62 team-games, 4.90 a club, against 4.28 in the 2026 regular season. By round it was 4.67 in the nine Wild Card games, 5.06 in the Division Series and 4.83 in the six League Championship games.
This October has been closer to a coin flip on the count. The club using fewer pitchers won 13 and lost 11, and 7 games had equal counts. Winners used 4.71 a game and losers 5.10. Three clubs used eight: Houston in a Wild Card loss on September 29, Cleveland in a Division Series win on October 8, and the Dodgers in that NLCS Game 2. Twenty-four games are far too few to say this year is different. Milwaukee leads the NLCS three games to none and has used 14 pitchers to the Dodgers’ 16. Cleveland leads the ALCS two games to one after winning Game 3 3–2 with five pitchers to Tampa Bay’s three.
What this does not say
This is a symptom, not a strategy. It does not say that a manager should leave a struggling starter in to keep the count down. A club uses more pitchers because it is in trouble, and taking out the starter is often the right response to that trouble. Our counts are pitchers, not innings or outs, so a reliever who gets one out counts the same as one who goes four innings. The game logs have no starter innings, so the early-runs panel uses runs allowed as a proxy for trouble. One rule tilts the count against our finding: a home club that leads after eight and a half innings doesn’t bat in the ninth, so the losing visitors pitch only eight innings. Our regular-season comparison covers 2010 to 2025 only, because those are the logs we keep, and the 2026 regular-season figure comes from the MLB Stats API rather than Retrosheet.
The bottom line
October clubs use more pitchers than they do all season, and the more a club needs, the more likely it is losing. In the regular season the count is noise. In the postseason it has separated winners from losers in every decade since 1903. When the bullpen graphic shows one side on its sixth pitcher, the count is mostly telling you about trouble that has already happened. For more October context, see what a series lead is worth, whether rest before a series costs anything and win probability added and leverage.
Reproduce it
The dataset is in the site’s data_layer/ folder, with provenance in data_layer/SOURCE.txt. build_postseason_pitchers_1903_2026.py builds it from Retrosheet’s game logs, our October 8 postseason file and the 2026 MLB Stats API reads described above. This counts the 2010–2025 postseason games by which club used fewer pitchers:
import json

path = "data_layer/postseason_pitchers_1903_2026_2026-10-15.json"
js = json.load(open(path, encoding="utf-8"))
fewer = more = same = 0
for g in js["postseason_games"]:
    if g["season"] < 2010 or g["win"] is None:
        continue
    if g["win"] == g["home"]:
        w, l = g["p_home"], g["p_away"]
    else:
        w, l = g["p_away"], g["p_home"]
    fewer += w < l
    more += w > l
    same += w == l
print(fewer, more, same)   # 320 162 135
The chart is charts/chart_postseason_pitchers.py. It recomputes every rate, the table, the early-runs panel from Retrosheet’s line scores and every 2026 figure in this article, and asserts each one before it draws the chart.
Sources & Further Reading
- Retrosheet postseason game logs 1903–2025 and regular-season game logs 2010–2025: pitchers used, length in outs, line scores and starting pitchers. The information used here was obtained free of charge from and is copyrighted by Retrosheet. Interested parties may contact Retrosheet at www.retrosheet.org.
- MLB Stats API: the postseason file retrieved 2026-10-08 for each game’s round, series and game number; for 2026, the postseason schedule, one boxscore per final game and the 2025 and 2026 season pitching totals, retrieved October 15, 2026.
- Built by
data_layer/build_postseason_pitchers_1903_2026.py; every figure is recomputed and checked bycharts/chart_postseason_pitchers.py.