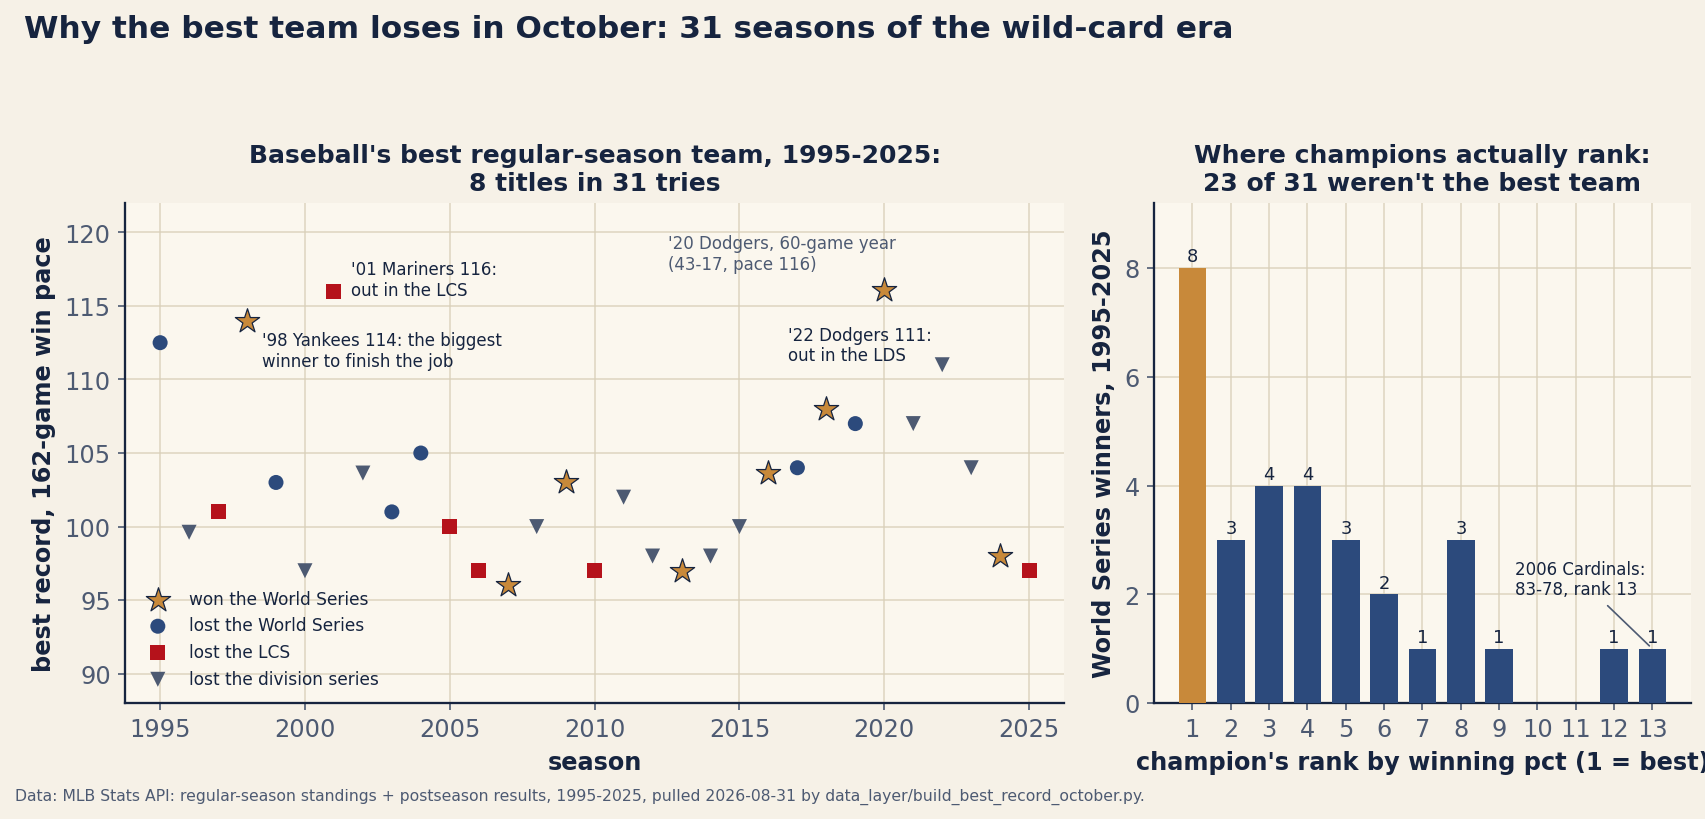
As of August 31, the Brewers own baseball’s best record at 85–52, and the polite thing to tell Milwaukee is the truth: the wild-card era has run this experiment thirty-one times, and the team holding that title in late September has gone on to win the World Series eight times. Not eight of the last ten — eight of thirty-one, 25.8 percent. The best team in baseball usually watches somebody else’s parade, and it has been that way since the format’s very first autumn, when the 100–44 Indians of 1995 lost the Series to a Braves club that had won ten fewer games.
The tempting explanations are narrative — pressure, momentum, some October gene the Yankees kept in a vault. The honest explanation is shorter: a best-of-seven series is a tiny sample, the gap between good teams is small, and three tiny samples in a row multiply against everybody, including the favorite. This piece pulls all thirty-one seasons from the standings and postseason record, counts what actually happened, and then does the arithmetic that predicts almost exactly that count.
The ledger, 1995–2025
The method is one query long. For every season since the wild card arrived, take the team (or teams — four seasons end in an exact tie for the best record) with the top winning percentage, then follow them through the bracket: 8 won the World Series, 6 got there and lost it, 6 died in the league championship series, and 11 — the largest group — never won a single series, going out in the division round. Add it up and the sport’s best regular-season team failed to even reach the World Series in 17 of 31 seasons. The casualty list is not a collection of flukes with soft records. The 116-win 2001 Mariners — tied for the most wins in the sport’s history — lost the ALCS in five. The 111-win 2022 Dodgers were swept out of the division series aside from one game. The 107-win 2021 Giants lost their first series too. Last October the 97-win Brewers went out in the LCS while the fifth-ranked Dodgers repeated as champions.
data_layer/build_best_record_october.py; drawn and asserted by charts/chart_best_record_october.py.The math does most of the explaining
Start with a generous assumption: suppose the best team in baseball is genuinely 55 percent to win any single postseason game — roughly a 89-win true talent’s edge over an 85-win one, and more than most October matchups actually offer, because the field is pre-filtered to good teams. The probability of winning a best-of-five is the sum of winning in three, four, or five games:
A seven-game series converts a 55–45 edge per game into barely 61–39 on the series — the format buys the favorite less than six points. Now compound it. A modern top seed must win a division series, an LCS, and a World Series: 0.593 × 0.608 × 0.608 = 21.9 percent. That is the whole story in one line. A team that is meaningfully better than every opponent it faces, at a level of dominance few teams achieve, should win the title about once in five tries. The observed rate for best-record teams — 8 in 31, 25.8 percent — is not evidence that October is broken or cursed. It is almost exactly what the binomial arithmetic hands a short format, with the small overshoot well inside the noise a 31-season sample carries.
The worked example makes it concrete. Take a 100–62 team against a 90–72 team and run Bill James’s log5 head-to-head — the standard way to turn two winning percentages into a matchup probability:
Ten full wins of regular-season superiority is worth 56.3 percent per game — a coin with a thumb on it, not a different coin. Over a best-of-seven that is 63.6 percent; over three such rounds, 25.0 percent. Run the gauntlet against ten-games-worse opposition at every step and you still lose three Octobers in four. Nothing about clutch, chemistry, or momentum is required to produce the ledger above. A 162-game season is long enough that the best team reliably surfaces; a 19-game October maximum is short enough that it reliably doesn’t.
Who actually wins, then
If the favorite takes it only a quarter of the time, the champion has to come from below — and the distribution of where is the second panel above. The median World Series winner since 1995 ranked fourth in the regular season; the mean is 4.3; twelve of the thirty-one ranked fifth or worse. The tail is long and includes some famous parades: the 2000 Yankees won it all ranked ninth at 87–74, the 2019 Nationals ranked eighth, the 2021 Braves ranked twelfth at 88–73, and the 2006 Cardinals hold the floor — 83–78, thirteenth-best team in baseball, world champions. The heaviest favorites of the era split their verdicts almost evenly:
| Season | Best record | W–L | October |
|---|---|---|---|
| 2001 | Mariners | 116–46 | lost the LCS |
| 1998 | Yankees | 114–48 | won the World Series |
| 2022 | Dodgers | 111–51 | lost the division series |
| 2018 | Red Sox | 108–54 | won the World Series |
| 2019 | Astros | 107–55 | lost the World Series |
| 2021 | Giants | 107–55 | lost the division series |
One more cut worth an honest look: winning 100 games buys no October insurance at all. Twenty of the thirty-one best-record teams won 100-plus, and four of the twenty (20 percent) won the title; the eleven best-record teams that got there with fewer than 100 wins won four of eleven (36 percent). That is not evidence that winning less helps — both samples are small and overlapping eras confound it — but it is firm evidence that winning more doesn’t compound. Once you’re the top seed, the gauntlet doesn’t care about your margin. And the newest format wrinkle has not rescued the favorite: since the 2022 bracket gave the top seeds a first-round bye, the best-record team is 1-for-4, with the 111-win Dodgers and 104-win Braves both losing their opening series off the rest — whether the bye itself hurts is a live argument the sample can’t settle, and this site’s position is the boring one: four seasons prove nothing either way.
What this does not say
Five limits, stated plainly. First, the per-game probabilities are stylized: real series odds move with rotation setup, injuries, home field, and roster construction, and log5 on raw winning percentage ignores schedule strength — the framework explains the scale of October randomness, not any particular series price (the playoff-odds piece covers how the real models differ). Second, 31 seasons is itself a short sample: 8 titles against a ∼22 percent expectation is a difference of about one title from noise alone. Third, in the four tie seasons (2003, 2006, 2007, 2013) the ledger follows the co-leader who advanced furthest, which flatters the “best team” slightly — strict per-team accounting would make the favorite’s record look worse, not better. Fourth, champion rank is computed on winning percentage alone, so tied teams share a rank, and two seasons (the 144-game 1995, the 60-game 2020) are shorter schedules honestly plotted as paces in the chart. Fifth, the bracket itself changed — eight playoff teams in 1995, ten in 2012, twelve with byes in 2022, and 2020’s one-off sixteen — so the gauntlet’s length is constant at three series for a top seed in every season except 2020, when the champion Dodgers had to win four.
The bottom line
The regular season identifies the best team; October identifies a good team that went 11–5 in the right three weeks. Both are real competitions — they are just different competitions, and the second one is arithmetically incapable of crowning the first one reliably. So the September story on this site — the clinch countdowns, the price of the last seat — is about the race that a 162-game sample actually settles. As for 2026: the Brewers’ 85–52 is the sport’s best record as of August 31, and if they hold it, history’s honest quote for their November odds is about one in four. That is not pessimism about Milwaukee. It is respect for what a best-of-seven is.
Reproduce it
The dataset ships in the site’s data_layer/ (provenance in data_layer/SOURCE.txt), rebuilt from the MLB Stats API by build_best_record_october.py; the accounting is a filter and the math is a binomial sum:
import json
from math import comb

js = json.load(open("data_layer/best_record_october.json", encoding="utf-8"))
for s in js["seasons"]:
    best = "/".join(b["name"] for b in s["best"])
    print(s["season"], best, "->", s["best_outcome"],
          "| champ:", s["champion"]["name"], "rank", s["champion"]["rank"])

won = sum(s["best_outcome"] == "won the World Series" for s in js["seasons"])
print(won, "of", len(js["seasons"]))          # 8 of 31

def series(p, need):                           # P(win a best-of-(2*need-1))
    q = 1 - p
    return sum(comb(need - 1 + j, j) * p**need * q**j for j in range(need))

p = 0.55
print(series(p, 3), series(p, 4))              # 0.5931, 0.6083
print(series(p, 3) * series(p, 4) ** 2)        # 0.2195 -- the gauntlet
The chart is charts/chart_best_record_october.py: it recomputes every number this article publishes from the bundled JSON at run time — the 8/6/6/11 outcome split, the champion-rank distribution, the tie seasons, the 100-win split, the log5 and gauntlet arithmetic — and hard-asserts each one, with a drift warning if the live 2026 snapshot has moved past the August 31 pin.
Sources & Further Reading
- Regular-season standings and postseason results, 1995–2025: MLB Stats API, pulled 2026-08-31 and bundled as
data_layer/best_record_october.json; 2026 standings fromdata_layer/mlb_2026_standings_2026-08-31.json— a frozen, dated copy of the live standings file, served alongside it so these figures stay checkable after the next refresh (retrieved 2026-08-31, Brewers 85–52). - The log5 matchup formula is Bill James’s (1981 Baseball Abstract); background at SABR. Postseason format history — eight teams from 1995, ten from 2012, twelve with first-round byes from 2022: MLB.com, public record; season anchors cross-checkable at Baseball-Reference.
- The house pieces this one leans on: what a playoff seat costs now, the magic number, explained, why playoff-odds models disagree, and the 2026 season page (final standings).