Originally published July 17, at the All-Star break; re-priced through the games of August 15, and again through the games of September 3, 2026. Under four weeks of season remain, and every fan of a team within shouting distance of a race is doing the same thing: scrolling the schedule and counting the soft spots. We did the counting properly. We pulled every 2026 regular-season game still to be played — 331 of them, from the public MLB Stats API schedule feed — and priced each club’s remaining slate by the current winning percentage of the opponents on it, weighted by how many times they still meet. Two findings, and they pull in opposite directions. First, the honest one: the spread is small, and it shrinks as the season does — the hardest remaining road in baseball (the Reds’ opponents sit at .581) and the softest (the Mariners’ at .409) now differ by under four wins’ worth of schedule, and most contenders live within one win of neutral. Second, the interesting one: the softest slate in the league belongs to a club that is still, just barely, in its division race — Seattle, five games out in the AL West, finishes against almost nobody with a winning record.
The method, and one worked example
Strength of schedule here is the simplest defensible version: for each team, take every opponent left on its slate, weight that opponent’s current winning percentage by the number of remaining meetings, and average. We pulled the full 2026 schedule (2,458 regular-season entries), kept every game not yet decided as of the September 3 snapshot, and dropped the 27 postponed entries whose makeup dates already appear as separate games — after that housekeeping, every club’s completed-plus-remaining games sum back to its 161 or 162. Opponent records come from the standings snapshot bundled inside the same file, the same pull that fed the 2026 season page that day.
The Mariners, end to end — the league’s softest road by a wide margin. They have 22 games left: seven against the Athletics (.386), seven against the Angels (.379), three against the Rangers (.493), three against the Rockies (.386) and two against the Astros (.507). Multiply each opponent’s win% by the meetings, sum, and divide: 9.01 expected-opponent-wins’ worth over 22 games, or a weighted opponent win% of .409. To turn that into something a standings-watcher can use, compare it with a neutral all-.500 slate: (.409 − .500) × 22 = −2.0 wins of schedule, the softest figure in baseball. Twenty of those 22 games — 91 percent — come against teams currently under .500. The catch is the one every schedule argument runs into: Seattle is five games back of Houston with 22 to play, and a two-win tailwind does not cover a five-game deficit unless the Astros cooperate. Two of those 22 are against Houston, which is the only part of the slate that can move the gap in both directions at once.
The league at a glance
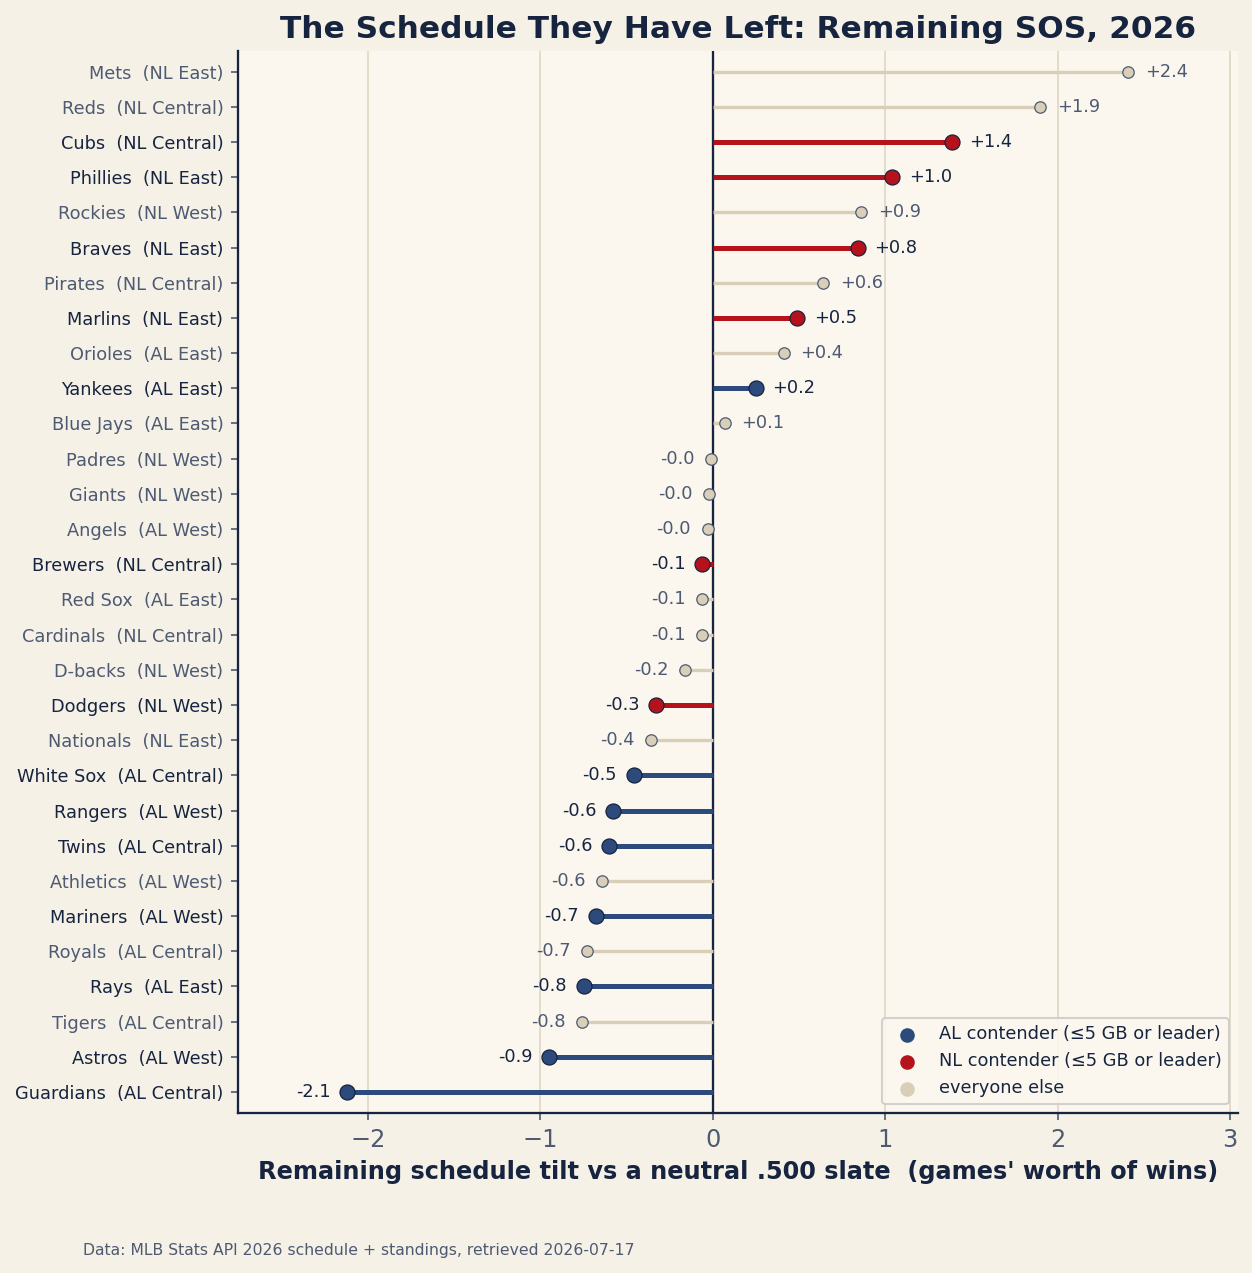
Read the axis before the team names, because the axis is the finding: the entire league fits between −2.0 and +1.8, and with only about 22 games left apiece there is very little runway for any of it to matter. The standard deviation of remaining-opponent win% across the 30 clubs is .031, which over a typical 22 remaining games is about 0.7 wins. Schedule tilt in September is real, computable, and mostly worth less than one swing game — while a .500 team’s 22-game record carries a binomial standard deviation of about 2.3 wins. Anyone selling you a September narrative built primarily on strength of schedule is selling rounding error — with one exception we’ll get to.
The hardest road in baseball belongs to a non-contender, and it is brutal: the Reds (.581, +1.8), buried 20 games back, still owe seven games to the Dodgers, six to the Brewers, three to the Cubs and three to the Braves — 19 of their final 22 against teams playing .550 ball or better. One structural note on the other tail: the correlation between a team’s own win% and its remaining opponents’ win% runs slightly positive (+0.19, close to the +0.18 of mid-August and up from −0.09 in July) — the soft end of the chart is crowded with American League clubs, contenders included, while the NL’s powers still owe each other a stack of head-to-head games. Either way, a correlation that small is indistinguishable from noise on thirty points.
| Race | Team | W–L | GB | Left | H/R | Opp win% | Tilt (wins) |
|---|---|---|---|---|---|---|---|
| AL East | Rays | 83–56 | — | 23 | 9/14 | .522 | +0.5 |
| Yankees | 80–60 | 3.5 | 22 | 13/9 | .498 | −0.1 | |
| AL Central | White Sox | 73–66 | — | 23 | 13/10 | .467 | −0.8 |
| Guardians | 70–69 | 3.0 | 23 | 11/12 | .475 | −0.6 | |
| AL West | Astros | 71–69 | — | 22 | 10/12 | .508 | +0.2 |
| Rangers | 69–71 | 2.0 | 22 | 13/9 | .511 | +0.2 | |
| Mariners | 66–74 | 5.0 | 22 | 13/9 | .409 | −2.0 | |
| NL East | Braves | 83–57 | — | 22 | 9/13 | .540 | +0.9 |
| Phillies | 79–61 | 4.0 | 22 | 13/9 | .549 | +1.1 | |
| NL Central | Brewers | 87–53 | — | 22 | 9/13 | .510 | +0.2 |
| NL West | Dodgers | 82–57 | — | 23 | 13/10 | .471 | −0.7 |
What changed since August — and the races that are left
The August version of this piece built its story on the NL Central, where the Cubs sat four games back of the Brewers carrying the hardest contender slate in baseball. Three weeks settled it in the least dramatic way available: Milwaukee went on winning, Chicago did not close, and a four-game gap is now nine. The same thing happened to Cleveland’s famous soft schedule — the Guardians still have one of the softest contender slates in the league (.475, −0.6), and they are still chasing, but three games back of the White Sox with 23 to play the schedule is now the smallest of their problems. That is the recurring lesson of these re-pricings: a one-win tilt is a real edge and it is almost never the thing that decides a division.
The races that remain are four, and two of them are genuinely live. The AL West is the tightest: the Astros lead the Rangers by two and the schedule declines to pick a side — Houston’s tilt is +0.2, Texas’s +0.2, a difference of nothing at all. Seattle is the interesting third party, five back with by far the softest road in baseball; the arithmetic says the slate is worth about two wins against a neutral one, which is real and still probably not enough. The AL Central is the other live one: the White Sox lead the Guardians by three, and both finish soft (−0.8 and −0.6), so neither gets a schedule alibi. In the AL East the Rays lead the Yankees by 3.5 with the harder road (+0.5 against −0.1) and a 9/14 road-heavy finish, which is the one place on this table where the schedule leans against the leader by more than a rounding error. And the NL East is a four-game Braves lead over a Phillies club whose remaining slate is the hardest of any contender (.549, +1.1) — a headwind, but the two clubs still meet seven times, which no strength-of-schedule number can arbitrate. We priced those meetings separately in the head-to-head endgame.
Elsewhere the schedule has stopped mattering because the standings did the sorting. The Brewers are nine up in the NL Central with a neutral slate (+0.2), and the Dodgers are nine up in the NL West with a soft one (−0.7); for both, the remaining interest is the run-differential ledger, not the division.
Home and road: even smaller than you think
The other thing fans count is home dates, so we priced those too. Home teams have won 1,104 of 2026’s 2,100 completed games — a .526 rate, on the low side of the historical .530–.540 band. At that rate, each game shifted from road to home is worth about 0.05 wins. The most home-heavy remaining schedule in baseball — 13 home against nine road — is shared by eight clubs: the Phillies, Orioles, Rangers, Rockies, Royals, Yankees, Pirates and Mariners. That four-game surplus is worth roughly 0.2 wins. The worst deficit — the Angels’ seven home against 15 road — costs about 0.4. Home-road imbalance in a remaining schedule is, at 2026’s home-field advantage, close to a pure nothing: we computed it so you don’t have to.
Limitations, stated plainly
Three honest problems with any remaining-SOS number, including this one. First, it is a snapshot pretending to be a forecast: we priced opponents at their September 3 win%, and while the July 31 trade deadline has already reshaped these rosters, September call-ups, rest days and clubs playing out the string will keep remaking them, and season-to-date records only partly predict September play. Second, current win% is itself contaminated by the very luck this site keeps writing about, and it makes no iterative opponent-of-opponent adjustment the way Baseball-Reference’s SRS does; a team also never plays itself, which nudges the own-record correlation noted above. Third, and most important: the spread is small relative to noise. A .500 team’s 22-game record has a binomial standard deviation of about 2.3 wins — larger than the entire league-wide schedule spread. Outside Seattle’s outlier slate, every contender gap in the table is smaller than one swing game, and we would treat it accordingly.
Reproduce it
The bundled snapshot is data_layer/remaining_schedule_2026-09-03.json — a dated, frozen copy of the file this piece was written against, so that the numbers above stay checkable after the live builder refreshes remaining_schedule_2026.json. Both are served from this site. It was built from the MLB Stats API schedule endpoint (/api/v1/schedule?sportId=1&season=2026&gameType=R across the full season date range), joined to the standings snapshot for opponent records. A game counts as remaining if its status is not Final at retrieval; Postponed entries are dropped because their makeups appear as separate entries. The whole computation is a weighted mean:
for each team T:
    opp_pct(T)  = sum(win%[opp] * games_left_vs[T][opp]) / remaining_G[T]
    tilt_wins(T) = (opp_pct(T) - 0.500) * remaining_G[T]

# Mariners: 9.01 / 22 = .409  ->  (.409 - .500) * 22 = -2.0 wins
# league:   mean opp_pct = .500, sd = .031  (~0.7 wins over 22 games)
Every figure in the table, the statline and the prose above is that arithmetic applied to that one file — each team’s opp_winpct and sos_wins_vs_500 are stored in it directly, and its opponents map carries the remaining meetings the worked example sums. Home-field value comes from the same snapshot’s completed games (1,104 home wins in 2,100 decided).
Sources & Further Reading
- 2026 remaining schedule and completed-game results: MLB Stats API schedule endpoint (gameType=R), bundled as
data_layer/remaining_schedule_2026-09-03.json(retrieved 2026-09-03; games not yet final at retrieval counted as remaining). - Opponent records: MLB Stats API standings, carried inside that same file as the
standings_snapshotblock and each team’s W–L. Two completed-game counts sit in the file and they count different things:completed_games= 2,100 is the schedule feed’s tally of entries already final, whilestandings_snapshot.games_played_total= 2,099 is the standings endpoint’s own count at its pull minutes earlier. The home-field figures use the schedule’s 2,100; the opponent win% uses the standings’ 2,099. - Sports-Reference, “SRS Calculation Details” — the iterative, opponent-adjusted rating this simple snapshot method deliberately is not.