At the 2026 All-Star break — the snapshot this piece is built on — the Philadelphia Phillies are 54–43, two games out in the NL East, seventh-best record in baseball. They are also, by one defensible reading, a losing team. In games decided by exactly one run they are 19–6, a .760 clip. In every other game — the ones settled by two runs or more — they are 35–37. Rank the thirty clubs by that second number and Philadelphia falls from seventh to twentieth. Their season, so far, lives in the close ones.
Sabermetrics has an old and blunt verdict on records like that: winning one-run games is mostly not a skill, and it is the single biggest reason standings drift away from team quality. That claim is usually defended with decades of history. We wanted to test it live, on the 2026 season, with the splits the MLB Stats API publishes for every club — a midseason snapshot through the games of Sunday, July 12, with the league at its All-Star pause. The headline: across thirty teams, the correlation between one-run winning percentage and winning percentage in all other games is r = 0.16 — statistically indistinguishable, at this sample size, from close games being coin flips.
The 2026 one-run ledger
First the raw material. Through July 12 the league has played 1,444 games and 381 of them — 26.4 percent, roughly one game in four — were decided by a single run. That share is the normal state of baseball: the five full seasons from 2021 to 2025 landed between 27.8 and 29.4 percent, so 2026 is running a touch calm but well inside the band. Every team has already banked a meaningful stack of these games, from the Astros’ 16 to the Guardians’ 33.
The table splits each extreme team’s record in two: one-run games versus everything else. The “gap” column is one-run win% minus rest-of-games win% — positive means the club has been better in the close ones than its everyday play.
| Team | One-run | All other games | Gap | Overall |
|---|---|---|---|---|
| Phillies | 19–6 (.760) | 35–37 (.486) | +.274 | .557 |
| Rangers | 17–10 (.630) | 32–37 (.464) | +.166 | .510 |
| Rockies | 14–14 (.500) | 25–45 (.357) | +.143 | .398 |
| Athletics | 14–13 (.518) | 27–42 (.391) | +.127 | .427 |
| White Sox | 19–13 (.594) | 31–32 (.492) | +.102 | .526 |
| … | ||||
| Tigers | 9–16 (.360) | 35–36 (.493) | −.133 | .458 |
| Brewers | 15–14 (.517) | 44–23 (.657) | −.139 | .615 |
| Braves | 11–13 (.458) | 44–27 (.620) | −.161 | .579 |
| Orioles | 7–14 (.333) | 39–37 (.513) | −.180 | .474 |
| Yankees | 9–13 (.409) | 45–29 (.608) | −.199 | .562 |
Read the bottom half and the pattern jumps out: it is the good teams down there. The Yankees are 45–29 when a game is decided by two or more runs — a .608 clip — and 9–13 when it comes down to a run. The Brewers, owners of baseball’s best rest-of-games record at .657, are a coin-flip 15–14 in the close ones. The Braves and Orioles have shed real ground in the standings the same way. Meanwhile two of the American League’s three division leaders at the break, the White Sox and the Rangers, have losing records in games decided by two or more runs (.492 and .464) and lead anyway at the snapshot, carried by a combined 36–23 in one-run games.
The test: quality barely shows up in close games
If close games were won by better teams the way blowouts are, a scatter of one-run win% against rest-of-games win% would climb along the diagonal. Here is that scatter for 2026.
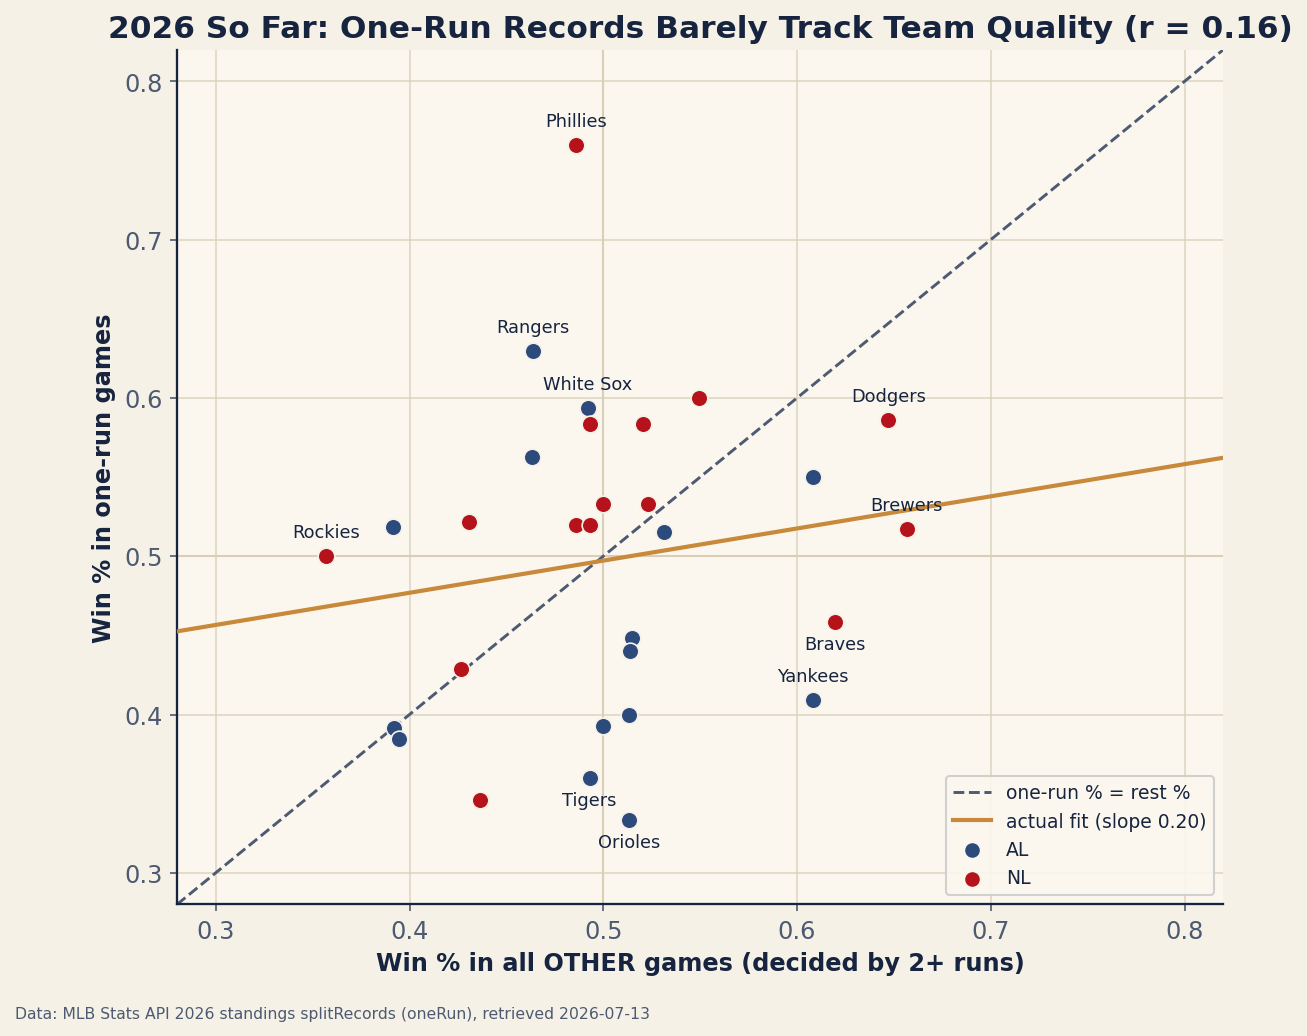
The cloud is nearly flat. The correlation is 0.156; the fitted line says a team that is 100 points of winning percentage better than another in ordinary games has been only about 20 points better in one-run games. And the spread runs the wrong way for a skill story: one-run percentages range from .333 to .760 (standard deviation .096) while rest-of-games percentages span .357 to .657 (SD .073) — the smaller sample is wider, exactly what binomial noise produces and exactly what talent does not.
An r of 0.16 on thirty teams deserves a proper benchmark, so we simulated two competing worlds, 20,000 seasons each, holding every team’s actual one-run game count fixed. In the coin-flip world, every team wins each one-run game with probability .500 regardless of quality: the observed correlations center on zero and land at or above 0.156 about 21 percent of the time. The real 2026 is a perfectly ordinary draw from that world. In the same-talent world, each team wins its one-run games at its rest-of-games percentage: the correlation centers on 0.60 and falls at or below 0.156 about once in a thousand trials. The real 2026 is close to impossible in that world. Close games in 2026 look far more like coin flips than like baseball.
One honest wrinkle: a half season is a small sample, and full seasons show a little more signal. Running the identical calculation on the five completed seasons 2021–2025 gives correlations of .361, .466, .028, .143 and .257 — averaging roughly 0.25, positive but weak, and swinging wildly year to year. The fairest summary of both the history and 2026: better teams win close games slightly more often than bad ones, and the effect is small enough that a single season’s one-run record tells you almost nothing about who the better team is.
How improbable are the Phillies, really?
Here is where we resist the lazy version of the argument. “One-run records are luck” does not mean every extreme record is equally likely; it means deviations don’t reflect quality and don’t persist. The Phillies’ 19–6 is genuinely extreme even as luck: a true coin-flip team goes 19–6 or better in 25 one-run games only 0.7 percent of the time. Across thirty teams you would expect about 0.2 clubs to be that far out, and 2026 has one. So Philadelphia is either the recipient of a legitimately rare draw or is doing something real in close games — late-inning bullpen leverage is the usual candidate — and half a season of 25 games cannot distinguish the two. What the evidence does say is which way to bet: the sabermetric track record on teams like this, going back to the analysis of “Johnson effect” teams in the 1980s Baseball Abstracts, is that outlier one-run records collapse toward .500 far more often than they hold.
The stakes are concrete. The Phillies have banked 6.5 more wins than a .500 one-run record would have given them — at .760 instead of .486, call it six to seven wins of altitude in a division race they trail by two games. The same arithmetic runs the other way in the Bronx: the Yankees’ 9–13 in one-run games is two wins below even, on a roster playing .608 baseball otherwise. If both clubs simply play their everyday quality in close games from here, the standings gap between “teams built the same” closes on its own, no roster move required.
Where this sits in the luck toolkit
One-run records are the visible mechanism behind a statistic this site tracks all season: the gap between actual wins and Pythagorean expectation. A team that keeps winning by one and losing by five piles up wins its run differential never earned, and that shows up as Pythagorean overperformance — the 2026 season page carried that ledger during the season and now holds the final one, so we won’t rehash it here. The conversion rate is the other half of the story: at roughly 10.7 runs per win, a one-run margin is the cheapest win baseball sells, which is exactly why records built on them are fragile. And for the full-season version of this autopsy — what happened to clubs that rode (or were robbed by) the close ones across 162 games — the 2023 luck ledger is the companion piece: the 84-win, outscored Marlins of that season went an absurd 33–14 in one-run games.
Limitations, stated plainly
Three things this analysis cannot do. First, thirty teams is thirty data points: the 90 percent band on a correlation of zero spans roughly ±0.30 at this sample size, so we can say 2026 is consistent with coin flips and inconsistent with full skill transfer, but we cannot pin the true effect tightly — the five-season history says it is small and positive, not zero. Second, “one run” is a crude bucket: it includes extra-inning games (117 so far, 8.1 percent of the schedule, where the automatic runner adds its own coin-flip flavor) and treats a 1–0 duel the same as a 9–8 slugfest. Third, the margin is measured at the final out, not at the moment of maximum doubt — a game that ends 5–4 on a meaningless ninth-inning homer was never really close, and win-probability-based measures handle that better than any margin split can. None of these rescues a close-game-skill story; they just bound how much this one snapshot can prove.
Reproduce it
Everything above comes from one bundled snapshot, data_layer/one_run_2026.json, built by data_layer/build_one_run_2026.py from the public MLB Stats API standings endpoint — each team’s records.splitRecords carries a oneRun entry, and the rest-of-games record is simply the overall record minus it. The core computation, in full:
rest_W, rest_L = W - oneRun_W, L - oneRun_L
one_run_pct = oneRun_W / (oneRun_W + oneRun_L)
rest_pct    = rest_W / (rest_W + rest_L)
r = pearson(one_run_pct, rest_pct)          # 0.156 across 30 teams

# the two null worlds (20,000 trials each, one-run game counts held fixed)
sim_coin   = binomial(n=oneRun_G, p=0.5)      / oneRun_G   # r centers on 0.00
sim_talent = binomial(n=oneRun_G, p=rest_pct) / oneRun_G   # r centers on 0.60
The observed 0.156 sits inside the coin-flip distribution (21st percentile from the top) and outside the same-talent one (0.1st percentile). The chart is charts/chart_one_run_2026.py; the historical shares and correlations for 2021–2025 are stored in the same JSON under history, computed by the identical formula from the same endpoint.
Sources & Further Reading
- 2026 one-run and overall records, plus full-season splits 2021–2025: MLB Stats API standings
splitRecords, bundled asdata_layer/one_run_2026.json(retrieved 2026-07-13, through games of July 12). - Bill James, Baseball Abstract (1980s editions) — the original “Johnson effect” finding that teams exceeding their expected wins regress the following season.
- Tango, Lichtman & Dolphin, The Book: Playing the Percentages in Baseball — run-to-win conversion and the variance structure of close games.