“Which division is the strongest?” is a bar argument, and it usually gets settled with the one number least equipped to answer it: the pooled standings. Every intra-division game hands the division exactly one win and one loss — those games can’t leave the family, and they drag every division’s pooled record toward .500 no matter how good or bad it is. So this piece strips the family feuds out. Using the site’s live standings and the 2026 schedule’s intra-division game counts, both pulled the morning of August 13, 2026 with 1,816 games in the books, we computed every division’s actual record against the rest of the league, plus the one strength measure that never needed the surgery: run differential, which cancels within the family by construction.
The answer is a photo finish at the top and a landslide at the bottom. By wins banked against outsiders, the AL East leads at .550; by runs — the measure this site keeps telling you to trust — the NL Central is ahead, and not by a little. And 2,000 feet below both of them, the AL West is having one of the worst collective seasons a division can have.
Why you can’t just read the standings
A division’s pooled record blends two very different things: games against outsiders, which carry information, and games inside the division, which are zero-sum bookkeeping. The algebra is one line:
Worked example, the AL East. Its five teams have pooled to 323–280, a .536 winning percentage. The balanced schedule MLB has used since 2023 has every team play 13 games against each of its four division rivals — 130 intra-division games per division per season, a count we verified against the schedule feed rather than trusting the press release. The AL East has played 86 of its 130, and those 86 games contributed a perfectly useless 86–86 to the pool. Remove them and the division is 237–194 against everybody else: .550. That’s no rounding error: with about 28% of games played in-family, a division’s true distance from .500 is roughly 1.4 times what the pooled standings show. The same balanced schedule — all 29 opponents, every year — is also why this comparison is fairer than it used to be, when rivalry-heavy slates warped every cross-division claim.
The table, with the feuds removed
| Division | Pooled | Vs. rest | Vs-rest W% | Run diff | RD / vs-rest G | Over .500 |
|---|---|---|---|---|---|---|
| AL East | 323–280 | 237–194 | .550 | +141 | +0.33 | 3 |
| NL Central | 321–283 | 233–195 | .544 | +179 | +0.42 | 3 |
| NL East | 311–297 | 218–204 | .517 | +109 | +0.26 | 3 |
| NL West | 300–307 | 202–209 | .491 | −26 | −0.06 | 3 |
| AL Central | 289–315 | 201–227 | .470 | −45 | −0.11 | 1 |
| AL West | 272–334 | 186–248 | .429 | −358 | −0.82 | 1 |
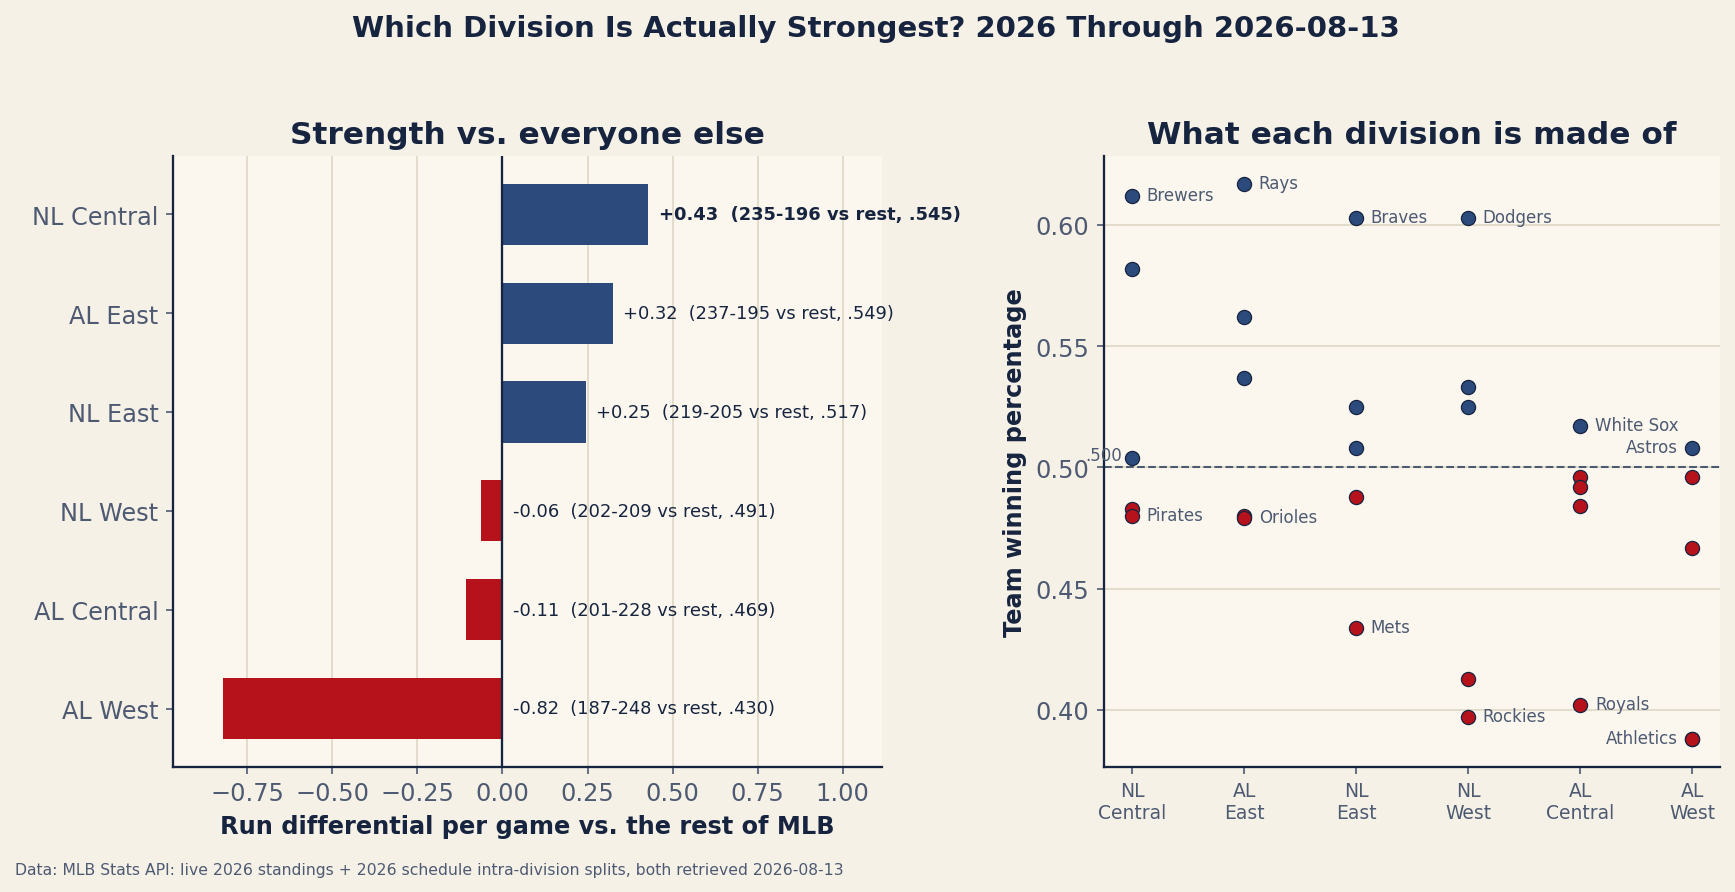
charts/chart_division_strength_2026.py.The two-horse race at the top
By banked wins the AL East and NL Central are separated by nothing: .550 to .544 is a two-and-a-half-game gap across about 430 vs-rest games each — coin-flip territory. By runs they are not close. The NL Central has outscored the rest of the league by 179 runs; the AL East by 141. Thirty-eight runs is real money — about three and a half wins by the 10.7-runs-per-win exchange rate this site fit to 60 team-seasons — and the house has already litigated which measure to trust when they disagree: run differential predicts the future better than the record does, and outperforming it is not a skill that persists. So, applying the house epistemology: the strongest division in baseball on August 13, 2026 is the NL Central — a Brewers–Cubs top two at +245 combined, a Cardinals team at 61–60 with a dead-even −1, and a 58–64 Pirates club that has somehow outscored its opponents by 13. Only the Reds (−78) are genuinely dragging. The AL East’s counterargument is the standings and the season’s best team — the 74–46 Rays, riding a nine-game winning streak — but its bottom two, the Blue Jays (−54) and Orioles (−36), are worse than anything in the Central except Cincinnati. Central by the runs, East by a nose in the wins. We’ll take the runs.
The landslide at the bottom
Nothing at the top of this table is as dramatic as its floor. The AL West is 186–248 against the rest of baseball — a .429 clip — and has been outscored by 358 runs, which works out to −0.82 per vs-rest game. All five members have negative run differentials, the only division where that’s true. Its best record belongs to the 62–60 Astros, who have been outscored by 27 runs; its bottom is the Angels and Athletics, tied at 47–74, the A’s carrying a −180 that is the worst differential in the sport. Someone from this division is guaranteed a playoff spot, and the numbers suggest whoever it is will arrive as the weakest division champion of the balanced-schedule era — though the AL Central, led by a .521 White Sox team while the Tigers sit at 59–61 despite a +87 differential (the flagship snapshot has them as baseball’s unluckiest team), is competing hard for that honor.
Zoom out one level and the division story becomes a league story. Intra-league runs cancel just like intra-division runs do, so each league’s total run differential is earned entirely in interleague play — and the NL is at +262. When this site ran the same ledger on 2023, the NL’s edge was 44 runs over a full season and worth calling a fingertip verdict. This is not a fingertip. Nine NL teams are over .500; five AL teams are. The AL East is carrying its entire league.
Strong is not the same as deep
The right panel of the chart is there because “strongest” hides a second question: strongest how? The NL West is the sport’s most top-heavy division — the .603 Dodgers own MLB’s best differential at +142, floating above a division that is collectively 26 runs underwater, with the Giants and Rockies both losing at least 58% of their games. The spread of member winning percentages there (.078) is the widest in baseball; the AL Central’s (.040) is the narrowest, five teams huddled between .402 and .521 in a division-wide argument about who wants it least. The two strongest divisions are strong in the healthiest way: three teams over .500 apiece, a genuine best team at the top, and only one true anchor each.
Limitations, stated plainly
Four honest ones. First, this is a dated snapshot: 1,816 games played, teams averaging 121.1, roughly 41 to go — and the .550/.544 wins gap at the top is well inside noise. In a season this bunched, ranks two through four could reshuffle by October. Second, the standings and schedule endpoints were pulled minutes apart and disagree by one completed game (1,816 vs. 1,817), so every vs-rest record here is exact to within a game; we checked the derived records against the schedule feed directly, and that lone game is the only discrepancy. Third, a division’s vs-rest slate excludes itself, which flatters the strong and further indicts the weak: the AL West compiled its .429 against a rest-of-league winning at .510, while the AL East and NL Central faced .493 and .494 worlds. That adjustment stretches the gaps rather than closing them — the AL West is, if anything, worse than .429 implies. Fourth, no deeper strength-of-schedule model is applied and nothing here is a projection; for who plays whom from here, the remaining-schedule piece is the right tool.
The bottom line
Strip out the games that can’t tell you anything and 2026 has a clear shape: two great divisions, one good one, two mediocrities, and a disaster. The AL East has banked the most wins against outsiders; the NL Central has outplayed everyone by the measure that actually predicts, by enough that we’re comfortable naming it the strongest division in baseball as of August 13. The distance from either of them down to the AL West is measured in hundreds of runs — 499 from the East, 537 from the Central — with all five of its teams underwater and a division champion sure to arrive in October carrying the sport’s weakest credentials. Bar arguments about the top of this list are healthy. There is no bar argument about the bottom.
Reproduce it
Both files ship in the site’s data_layer/ (provenance in data_layer/SOURCE.txt), and the whole exhibit is one loop:
import json
from collections import defaultdict

stand = json.load(open("data_layer/mlb_2026_standings_2026-08-13.json", encoding="utf-8"))
sched = json.load(open("data_layer/remaining_schedule_2026-08-13.json", encoding="utf-8"))

division = {t["short"]: t["division"] for t in stand["teams"]}
intra_left = defaultdict(float)
for t in sched["teams"]:                       # remaining intra-division games
    for opp, n in t["opponents"].items():      # (each game is on two teams' lists)
        if division[opp] == t["division"]:
            intra_left[t["division"]] += n / 2

by_div = defaultdict(list)
for t in stand["teams"]:
    by_div[t["division"]].append(t)

for name, ts in sorted(by_div.items()):
    W = sum(t["W"] for t in ts); G = W + sum(t["L"] for t in ts)
    rd = sum(t["run_diff"] for t in ts)        # intra runs cancel: pure vs-rest
    played_intra = 130 - intra_left[name]      # 13 x 4 rivals x 5 teams / 2
    out_g, out_w = G - 2 * played_intra, W - played_intra
    print("%-11s vs rest %3.0f-%3.0f (.%03.0f)  RD %+d" %
          (name, out_w, out_g - out_w, out_w / out_g * 1000, rd))
The chart is charts/chart_division_strength_2026.py; it recomputes everything above at run time and asserts the accounting identity that total vs-rest wins equal half of total vs-rest games.
Sources & Further Reading
- Live 2026 standings and run totals, plus the full 2026 schedule with intra-division splits: MLB Stats API, bundled as
data_layer/mlb_2026_standings_2026-08-13.jsonanddata_layer/remaining_schedule_2026-08-13.json— frozen, dated copies of the two live files, served alongside them so these figures stay checkable after the next refresh (both retrieved 2026-08-13). - The balanced-schedule format (13 games vs. each division rival, all 29 opponents played) is MLB public record, in effect since 2023: MLB.com — and verified here against the schedule feed rather than assumed.
- The house doctrine this verdict leans on: run differential predicts next year, beating it isn’t a skill, and the 10-run rule.
- The 2023 edition of the league-strength ledger: Was the AL or NL Stronger in 2023?