Every July the races are said to feel closer than usual, and a feeling is not a measurement. This year the feeling survives the arithmetic. We took the site’s bundled 2026 standings snapshot — 1,459 games in, an average of 97.3 per team — and measured the league’s spread against the nine final seasons in the bundled 2015–2024 standings file, three yardsticks apiece: the standard deviation of team winning percentage, the top-to-bottom gap, and the count of teams within fifty points of .500. The 2026 spread is .062. Every one of the nine finals landed higher, from .063 (2015) to .096 (2019). And the order matters more than the margin, because a 97-game record carries more random noise than a 162-game one, not less — if talent were equal across years, the partial season should be the wide one. It is the narrowest instead. By every measure these files can produce, 2026 is the most bunched MLB season in at least a decade, and the honest statistical adjustment makes that finding stronger, not weaker.
Three yardsticks, one honest bias
The data is the same pair of files behind this site’s earlier balance work: mlb_2026_standings_2026-07-18.json, a frozen, dated copy of the live MLB Stats API standings snapshot as it stood on the morning of July 18, 2026, and standings_2015_2024.json, final regular-season records for 2015–2024 from the same API. One honest gap up front: the historical file omits 2020 entirely, because a 60-game season’s spread is not comparable to a 162-game season’s, so the “decade” here is nine final seasons, not ten. For each season we computed the population standard deviation of team win%, the gap between the best and worst records, and how many of the 30 clubs sat between .450 and .550. The 2026 numbers are identical whether we use the API’s win% field or recompute from wins and losses: .0620 either way.
Before any comparison, the bias, stated plainly: mid-season spreads run wide, and comparing one to final spreads tilts the table against parity, not toward it. A team’s observed win% is talent plus luck, and the luck term shrinks like 1/√n as games accumulate — a coin-flip league spreads out to a standard deviation of √(0.25/n), which is .0500 at 100 games but only .0393 at 162. Whatever spread 2026 shows through 97.3 games contains more residual luck than any of the nine final-season spreads it is being compared with. So the fair expectation, if 2026’s talent were spread like a typical recent season, is that its current SD should sit above the final-season numbers and drift down toward them by October. Finding it below all nine — before any correction — is therefore not an artifact of the early reading. It is the finding, with the bias running the other way.
The exhibit: nine finals and one partial season
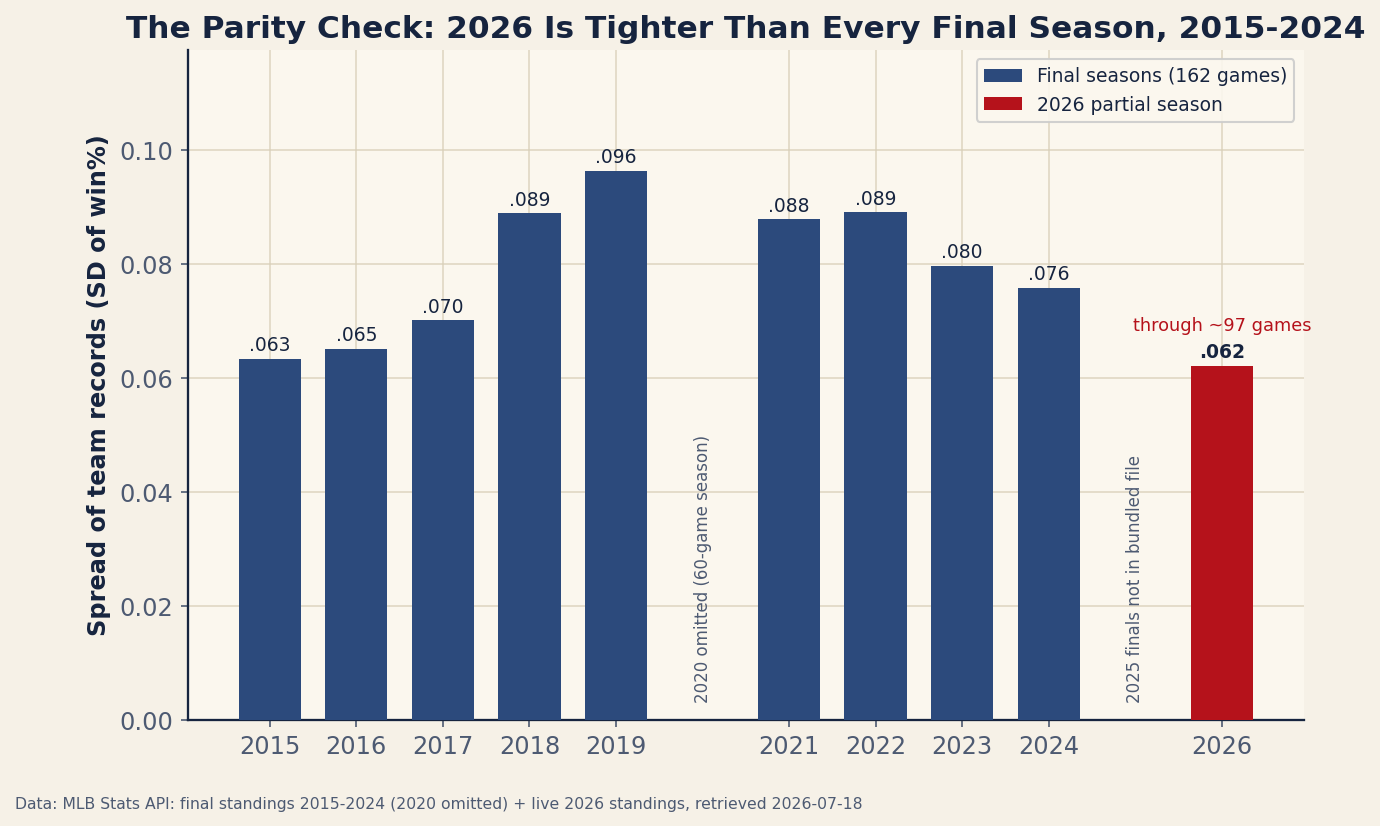
Read the red bar against the two navy bars at the left end first: 2015 (.063) and 2016 (.065) were the most balanced finals in the bundle, and 2026 is currently under both while still carrying a partial season’s extra noise. The rest of the shape is the story this site told in the competitive-balance piece: imbalance climbed through the tanking years to the 2019 peak — the Astros at .660, the Tigers at .292, a spread of 15.6 wins on the 162-game scale — then eased to 12.3 by 2024. On that same scale, 2026’s current spread is 10.0 wins.
| Season | SD of win% | SD × 162 | Top-to-bottom gap | Teams .450–.550 |
|---|---|---|---|---|
| 2015 | .0633 | 10.3 | .228 | 16 |
| 2016 | .0651 | 10.5 | .276 | 16 |
| 2017 | .0700 | 11.3 | .247 | 14 |
| 2018 | .0888 | 14.4 | .377 | 11 |
| 2019 | .0963 | 15.6 | .369 | 9 |
| 2021 | .0878 | 14.2 | .340 | 12 |
| 2022 | .0890 | 14.4 | .346 | 12 |
| 2023 | .0796 | 12.9 | .333 | 16 |
| 2024 | .0758 | 12.3 | .352 | 17 |
| 2026 so far | .0620 | 10.0 | .245 | 17 |
The secondary yardsticks agree with the headline one. The 2026 top-to-bottom gap — the .633 Dodgers (62–36) down to the .388 Angels (38–60) — is .245, smaller than eight of the nine finals; only 2015’s .228 beat it. There is no 2018 Red Sox (.667) at the top and no 2024 White Sox (.253, 41–121) at the bottom: the worst three records in baseball right now are the Royals (.398), Rockies (.394) and Angels (.388), and none of them is historically bad.
The luck floor, stepped through
Here is the √n machinery with real numbers, because it is the whole reason the comparison is fair to make in this direction. Imagine 30 teams of literally identical talent — every game a coin flip. Each team’s win% over n games then has a standard deviation of √(0.25/n). At 100 games that is √(0.25/100) = .0500; at 2026’s actual average of 97.3 games it is .0507; over a full 162 it is .0393. Pure luck spreads a 97-game league out to fifty-one points of win% — that is the floor no league can sit under, and playing out a full schedule lowers it to thirty-nine.
That floor lets you split any observed spread into talent and luck, since the two variances add: talent SD = √(observed² − luck²). For 2026 that is √(.0620² − .0507²) = .0357 of talent spread. Run the identical arithmetic on the nine finals (with the .0393 luck term at 162 games) and the estimated talent spreads run from .0497 (2015) up to .0879 (2019) — every single one above 2026’s. Equivalently, you can restate 2026’s spread as what it would look like with a full season’s smaller luck term: √(.0620² − 0.25/97.3 + 0.25/162) = .0531, about 8.6 wins on the 162 scale — under the decade’s previous floor of 10.3. And in the units of the Noll-Scully ratio — observed spread over the coin-flip floor at the same n — 2026 sits at 1.22, against a nine-season range of 1.61 to 2.45 (2023 was 2.03). However we slice it, the same answer: the compression is in the talent term, not the sample size.
Seventeen teams within fifty points of .500
The yardstick that translates most directly to watchability: 17 of 30 clubs currently sit between .450 and .550 — three of them (the Nationals, Red Sox and Twins) at .500 exactly. The nine bundled finals averaged 13.7 teams in that band; only 2024, with 17, ever matched what 2026 is doing right now. And the two counts are not equivalent, because at 97 games the luck term is still pushing teams out of the middle band, not into it. At the other extreme sits 2019, when just nine teams finished within fifty points of .500 and the league had effectively sorted itself into superteams and scrap heaps by June. The practical consequence shows up in that day’s standings, which our 2026 season page tracked during the season: beyond the three runaway division leaders — the Dodgers (.633), Brewers (60–37, .619) and Braves (56–40, .583) — nearly everything else is still a race, which is exactly what a .062 spread looks like from the inside.
Limitations, stated plainly
Four honest problems. First, 2026 is a snapshot, not a result: 1,459 games is about 60 percent of a schedule, the trade deadline had not yet arrived at the July 18 snapshot, and a deadline that sorts buyers from sellers could stretch the spread by October — the fair statement is that 2026 is on pace to be the tightest season in the bundle, not that it has finished as one. Second, the talent-luck split assumes every game is an independent coin weighted only by talent — it ignores schedule imbalance, home-field, and the fact that teams change midseason, so .0357 is an estimate with assumptions attached, not a measurement. Third, the bundle is nine seasons deep. It contains no 2020 (the 60-game year, deliberately) and no 2025 finals, and it cannot speak to expansion-era history — whether .062 would be remarkable against 1985 or 1968 is a question this file simply cannot answer, so “most bunched in a decade” is the full extent of the claim. Fourth, the .050 band around .500 is a convention, not a law of nature; it is the same band this site has used before, but the count is sensitive to where you draw it.
Reproduce it
Both files ship in the site’s data_layer/, and the whole computation is a dozen lines. The SD convention matches the earlier balance piece (population SD on the API’s win% field):
import json, math, statistics as st
from collections import defaultdict

live = json.load(open("data_layer/mlb_2026_standings_2026-07-18.json"))
hist = json.load(open("data_layer/standings_2015_2024.json"))

pcts = [t["winpct"] for t in live["teams"]]                # 30 teams
n    = sum(t["W"] + t["L"] for t in live["teams"]) / 30    # 97.3 games
sd   = st.pstdev(pcts)                                     # .0620
gap  = max(pcts) - min(pcts)                               # .633 - .388 = .245
mid  = sum(abs(p - 0.500) <= 0.050 for p in pcts)          # 17 teams
talent = math.sqrt(sd**2 - 0.25/n)                         # .0357

by = defaultdict(list)
for t in hist["teams"]:
    by[t["season"]].append(t["winpct"])
for s in sorted(by):
    print(s, round(st.pstdev(by[s]), 4))
# 2015 .0633 ... 2019 .0963 ... 2024 .0758 -- all nine above .0620
The chart is charts/chart_parity_2026.py; it reads only the two JSONs, so pointing it at any morning’s standings snapshot instead of the frozen July 18 copy re-scores the league’s parity against the same nine finals.
Sources & Further Reading
- Live 2026 standings: MLB Stats API regular-season standings, bundled as
data_layer/mlb_2026_standings_2026-07-18.json— a frozen, dated copy of the live standings file, served alongside it so these figures stay checkable after the next refresh (retrieved 2026-07-18; 1,459 games played at the snapshot). - Final standings 2015–2024: MLB Stats API, bundled as
data_layer/standings_2015_2024.json(retrieved 2026-06-21; 2020’s 60-game season omitted). - The coin-flip floor √(0.25/n) and the Noll-Scully framing are worked through in this site’s Noll-Scully explainer.