Monday’s parity check left a loose thread. 2026’s records are bunched tighter than any final season in the bundled decade — but a record is an output. Teams don’t huddle in the standings unless something huddles underneath, and the candidates are exactly two: the runs they score and the runs they allow. So we pulled the thread from the input side. The bundled 2021–2024 finals plus the live 2026 snapshot give five seasons of per-team scoring rates, and the gap between baseball’s best and worst offense right now is 1.52 runs a game — the Nationals at 5.48, the Blue Jays at 3.96. That is the narrowest offense gap of the five seasons, and it lands after four finals in which the gap did nothing but widen: 1.57 in 2021, 1.79 in 2022, 2.23 in 2023, 2.34 in 2024.
The other half of the ledger declines to cooperate, which is what makes this interesting rather than tidy. Run prevention has not compressed at all: the best-to-worst gap in runs allowed per game is 2.05, mid-range for the window, and prevention spreads the 30 clubs about 30 percent wider than offense does — a shape last seen in 2021 and 2022. Whatever has been squeezing the 2026 standings together is coming from the hitting side of the sport.
One gap, two files, and how this differs from the parity check
The yardstick is nothing exotic. A team’s scoring rate is runs scored divided by games played — over 162 for the finals, over each club’s actual count for 2026 (99 to 103 games at the July 22 snapshot, average 101.2). The offense gap is the best rate minus the worst. Alongside it we carry the population standard deviation of all 30 rates, because a max-minus-min is an order statistic one freak team can own outright — 2024 will demonstrate shortly. Runs allowed get the identical treatment.
Two words about the window, both honest. The parity piece ran 2015–2024 because it needed only wins and losses; the bundled decade file carries nothing but W–L, and per-team run columns enter the bundle only with the 2021–2024 standings file. No 2025 finals are bundled at all. So the claim here is “narrowest since at least 2021,” full stop. And the two pieces measure different things on purpose: the parity check measured the spread of records — the machine’s output — while this one measures the spread of the run-scoring inputs feeding it. They agree in direction, which is the point.
Four finals of widening, then the snap back
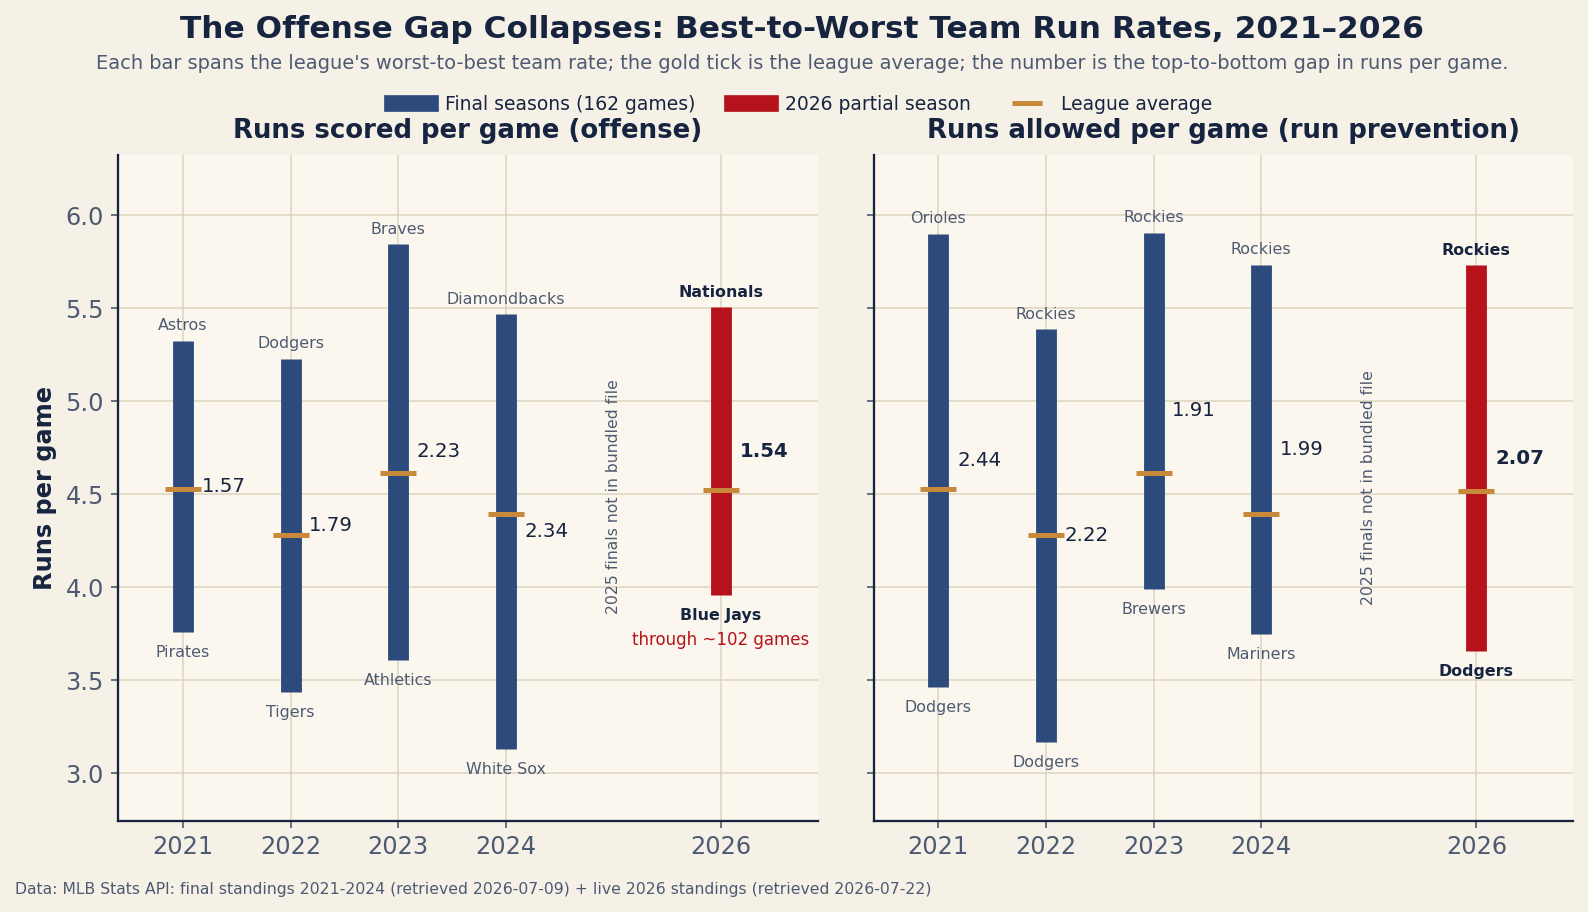
Read the left panel as an arc. The offense gap widened every single final season in the file — 1.57, 1.79, 2.23, 2.34 — and then 2026 snapped back below the start of the series. The standard deviation tells the same story with one instructive wrinkle: it runs .427, .437, .503, .458, and now .408, peaking in 2023 rather than 2024. That is the order statistic showing its seams. The 2024 gap was rented, not owned, by one team — the 121-loss White Sox scored 3.13 runs a game, about six tenths of a run below the next-worst offense (the Rays at 3.73) — so the broad offensive spread had already begun easing in 2024 even as its extreme got more extreme. In 2026 the two measures finally agree: gap (1.52) and SD (.408) are both the lowest in the window, which is why we read the compression as real rather than a tail artifact.
One objection to dispose of immediately: this is not a run-environment illusion. Absolute gaps scale with the level of scoring, but 2026’s league rate of 4.52 runs per team-game is essentially identical to 2021’s 4.53 — and as a share of the league rate the gap is 33.6 percent, the lowest of the five seasons (2021–2024 ran 34.6, 41.8, 48.4, 53.3). Offenses have genuinely converged; the league isn’t simply scoring less.
| Season | Best offense | Worst offense | Gap (R/G) | SD | Gap ÷ league R/G |
|---|---|---|---|---|---|
| 2021 | Astros, 5.33 | Pirates, 3.76 | 1.57 | .427 | 34.6% |
| 2022 | Dodgers, 5.23 | Tigers, 3.44 | 1.79 | .437 | 41.8% |
| 2023 | Braves, 5.85 | Athletics, 3.61 | 2.23 | .503 | 48.4% |
| 2024 | Diamondbacks, 5.47 | White Sox, 3.13 | 2.34 | .458 | 53.3% |
| 2026 so far | Nationals, 5.48 | Blue Jays, 3.96 | 1.52 | .408 | 33.6% |
It’s the floor that moved
Decompose the collapse and it is almost entirely a floor phenomenon. The ceiling is normal: the Nationals’ 5.48 is the second-best top rate of the five seasons, behind only the 2023 Braves’ 5.85. The floor is not normal at all. The four finals bottomed out at 3.76, 3.44, 3.61 and 3.13; the 2026 floor is 3.96, higher than every one of them by at least a fifth of a run. Count teams instead of extremes and the picture repeats: the finals had four, seven, two and five clubs scoring under 4.0 runs a game; 2026 has exactly one — Toronto, at 3.96, barely qualifying. There is no stranded offense in this league, no 2022 Tigers, no 2024 White Sox. The bad lineups of 2026 are merely bad, not broken.
The worked example, end to end. The Blue Jays have scored 400 runs in 101 games: 400 ÷ 101 = 3.960 a game. The Nationals have scored 559 in 102: 559 ÷ 102 = 5.480. The difference of the unrounded rates is 1.520, and stretching it over a 162-game schedule makes it concrete: about 246 runs separate the league’s best lineup from its worst, which at this site’s fitted rate of 10.7 runs per win is roughly 23 wins of pure offense. The same arithmetic on 2024’s gap gives 379 runs — about 35 wins. The distance between hitting like the best and hitting like the worst has shrunk by a dozen wins’ worth in two years.
Two details from the edges, because the edges have a sense of humor. The floor of the whole window — the 2021 Pirates and their 3.76 — has become 2026’s second-best offense: Pittsburgh is scoring 5.33 a game and sits 52–49. And the best offense in baseball belongs to a team sitting exactly at .500: the Nationals score 5.48 but allow 5.30, the third-worst prevention rate in the league, and are 51–51 for their trouble. Scoring is half a ledger. Where each club lands when you cross both halves is the run-scoring map this site drew in June, and Washington is its cautionary corner.
Run prevention still does the separating
Now the right panel. The prevention gap across the four finals ran 2.44, 2.22, 1.91, 1.99 — and 2026 sits at 2.05, inside that range, with a standard deviation of .533 that is higher than 2023’s (.498) and 2024’s (.444). Offense compressed; prevention did not. The regime change is cleanest as a ratio: prevention’s SD over offense’s was 1.30 in 2021 and 1.26 in 2022, fell to 0.99 and 0.97 in 2023–24 — hitting and pitching separating teams equally — and is back to 1.31 in 2026. Run prevention is once again the axis along which this league sorts itself.
The cast at the extremes barely rotates. The Dodgers own the best prevention rate for the third time in five seasons (3.46 in 2021, 3.17 in 2022, 3.66 now), and the Rockies own the worst for the fourth straight measured season — 5.39 in 2022, 5.91 in 2023, then 5.73 in 2024 and 5.71 so far in 2026, a number so consistent it reads like a typo. We will resist claiming a full decomposition of Monday’s finding — a spread of records also depends on how scoring and prevention correlate across teams, and on sequencing luck — but the modest version the files support: offense has bunched to its tightest in the window, prevention has not, and the record compression in the standings has at least one clearly visible engine.
Limitations, stated plainly
Four honest problems. First, 2026 is a snapshot at an average of 101.6 games, and a scoring rate estimated over 102 games carries a sampling-noise term about 26 percent larger than one estimated over 162 (noise shrinks like 1/√n, and √(162 ÷ 101.6) = 1.26). Note the direction: extra noise should make a partial-season spread wider, and 2026 posts the narrowest anyway — the bias runs against the finding. Still, “narrowest” means on pace, not finished; a July 31 deadline that splits buyers from sellers could stretch the gap by October. Second, the window is five seasons, not a decade — the decade file has no run columns and no 2025 finals are bundled — so “since at least 2021” is the entire claim; a longer history could well contain tighter seasons. Third, these are raw rates, unadjusted for park or opponent: Coors Field inflates the Rockies’ offense and batters their pitching in the same breath, and nothing here corrects for that. Fourth, max-minus-min is tail-bait — 2024’s gap was mostly one historically awful team — which is why the SD rides along throughout; both measures pointing the same way in 2026 is most of our confidence.
Reproduce it
Both files ship in the site’s data_layer/ (provenance for every bundled file is logged in data_layer/SOURCE.txt), and the computation is a dozen lines:
import json, statistics as st
from collections import defaultdict

hist = json.load(open("data_layer/standings_multiseason.json"))
live = json.load(open("data_layer/mlb_2026_standings_2026-07-22.json"))

def rates(teams):
    out = []
    for t in teams:
        g = t.get("games_played", t["W"] + t["L"])
        out.append(t["RS"] / g)
    return out

by = defaultdict(list)
for t in hist["teams"]:
    by[t["season"]].append(t)

for season, teams in sorted(by.items()) + [(2026, live["teams"])]:
    rs = rates(teams)
    print(season, round(max(rs) - min(rs), 3), round(st.pstdev(rs), 3))

# output:
#   2021 1.568 0.427     2022 1.79 0.437     2023 2.235 0.503
#   2024 2.34 0.458      2026 1.544 0.408    (2026 at ~102 games)
The chart is charts/chart_offense_gap.py; it reads only the two JSONs, so re-running it against any morning’s standings snapshot re-measures both gaps with zero code changes.
Sources & Further Reading
- 2026 standings: MLB Stats API regular-season standings, bundled as
data_layer/mlb_2026_standings_2026-07-22.json— a frozen, dated copy of the live standings file, served alongside it so these figures stay checkable after the next refresh (retrieved 2026-07-22; 1,518 games played, average 101.2 per team). - Final standings with per-team runs, 2021–2024: MLB Stats API, bundled as
data_layer/standings_multiseason.json(retrieved 2026-07-09; 2020’s 60-game season predates the file’s window and 2025 finals are not bundled). - For the level of scoring rather than its spread, this site’s 2026 run-environment piece puts the 4.5-runs-a-side era in twelve-season context.