Every winter, 30 fan bases look at last season’s record and quietly assume it’s a floor or a ceiling — that the 98-win team has established itself, that the 100-loss team has found its level. The standings disagree. We paired every team’s finish with the same franchise’s next finish across the bundled 2015–2024 standings — 210 back-to-back season pairs — and the league behaves like there’s a mass sitting at .500, bending every trajectory toward it. Teams that finished .600 or better came back 11.0 wins worse on average the following season. Teams that finished .400 or worse came back 8.0 wins better. Nobody parked in the middle moved at all: clubs that finished between .450 and .550 drifted a combined 0.2 wins the next year.
And the well is not symmetric. Both tails start almost exactly the same distance from the center — the .600-plus group averaged 21.6 wins above an 81-win pace, the sub-.400 group 22.0 wins below it — but one year later the winners had been dragged 51% of the way back to .500 while the losers had climbed only 36% of the way up. Gravity, in this league, pulls harder on the teams flying highest. This piece is the between-seasons sequel to the parity check, which measured how bunched a single season’s standings are; here the question is what the bunching does to teams that escape it.
Two files, one convention, and what this is not
The raw material is the bundled decade file: final regular-season records for all 30 teams, 2015 through 2024, with 2020’s 60-game season omitted — nine full seasons, 270 team-seasons, wins, losses, and winning percentage only. We matched teams by franchise ID across every pair of back-to-back calendar years, which yields seven usable transitions (2015→16 through 2018→19, then 2021→22 through 2023→24) and 210 pairs. The 2019→2021 jump across the missing season is excluded — two years of roster churn is a different question — though for the curious, the four teams that finished .600+ in 2019 averaged .643 then and .565 in 2021, which is the same story on a delay. Season lengths wobble by a game here and there (tiebreakers, unplayed makeups), so every change is expressed as the change in winning percentage times 162; for the examples below we quote actual win totals, and the two conventions never disagree by more than a rounding hair.
Two neighbors on this site, and the lane between them. The parity check is a static measurement — how tightly one season’s 30 records huddle around .500. It counted 45.6% of the decade’s team-seasons (123 of 270) inside fifty points of .500, bottoming at 9 such teams in 2019 and peaking at 17 in 2024. And the carryover piece already fit the overall year-to-year line on 2021–2024, finding r = 0.54. This article is the dynamic between those two: not how crowded the middle is, and not the average stickiness of everybody, but what happens specifically to the teams that leave the middle — the 26 team-seasons at .600 or better (9.6% of the decade) and the 30 at .400 or worse (11.1%). Extremes are rare. The question is whether they last.
The gradient: what this year’s record says about next year’s
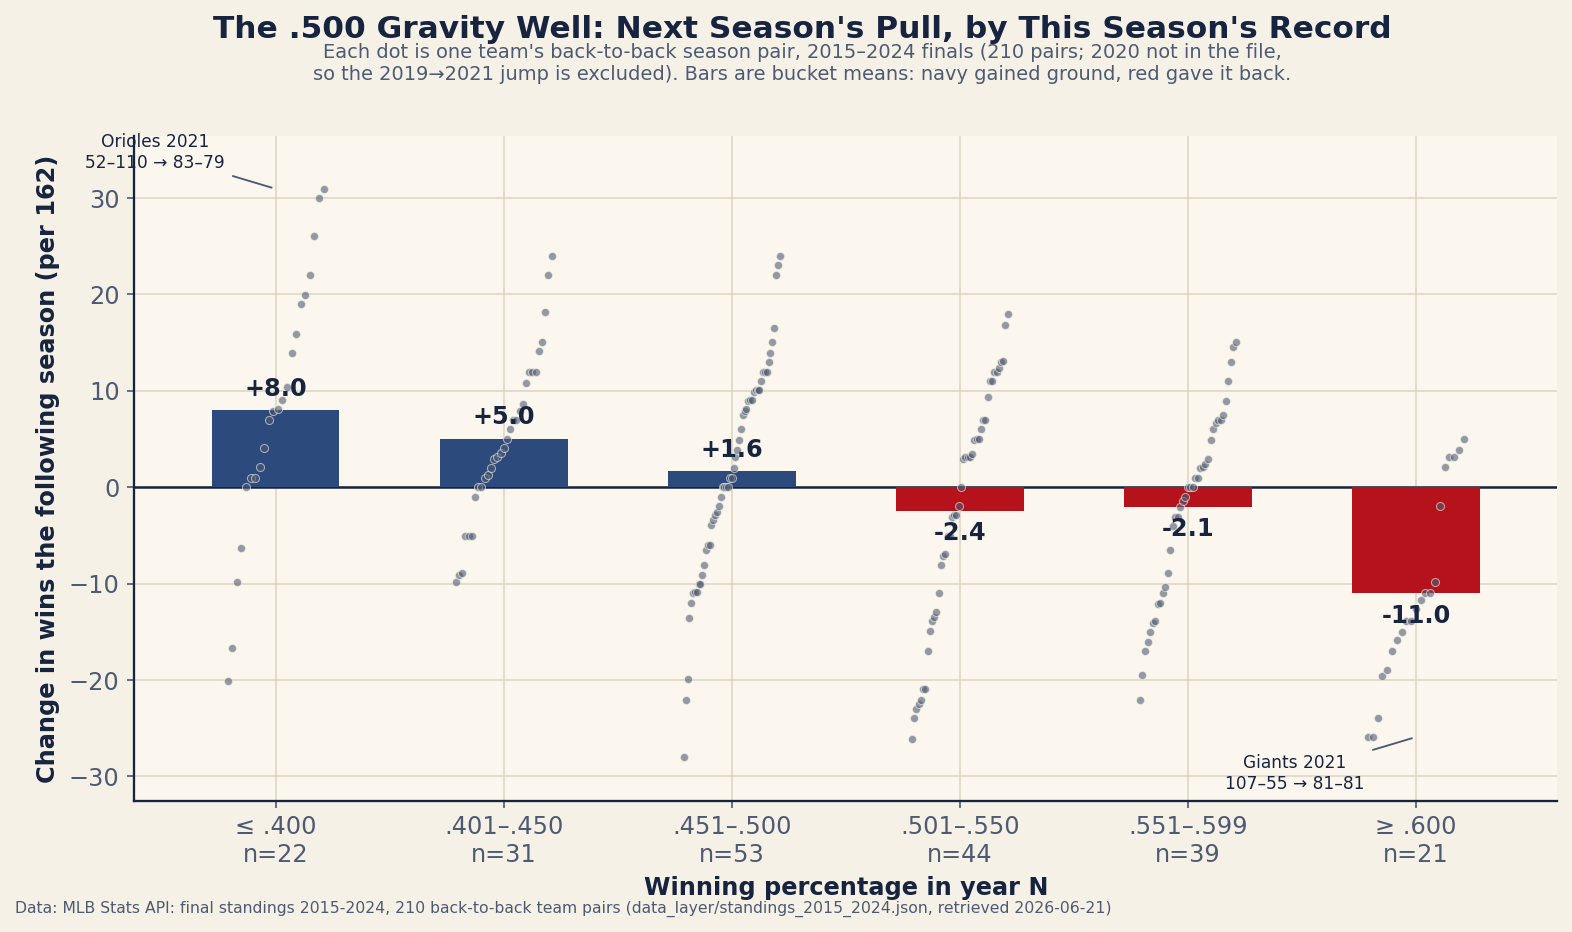
data_layer/standings_2015_2024.json (retrieved 2026-06-21).Read the bars left to right and the well draws itself: +8.0, +5.0, +1.6, −2.4, −2.1, −11.0. Every bucket below .500 gains ground the next season on average; every bucket above .500 loses it; and the pull strengthens with distance from the center — almost. The one wrinkle is that the .501–.550 and .551–.599 buckets are statistically indistinguishable (−2.4 vs −2.1), a plateau of respectability where next year looks a lot like this year. The cliff is reserved for the top shelf. Cross .600 and the average next season costs you eleven wins — four to five times the give-back of merely being good.
| Record in year N | Pairs | Mean win% (yr N) | Mean change (wins) | Median change |
|---|---|---|---|---|
| .400 or worse | 22 | .364 | +8.0 | +8.0 |
| .401–.450 | 31 | .422 | +5.0 | +4.1 |
| .451–.500 | 53 | .475 | +1.6 | +1.0 |
| .501–.550 | 44 | .526 | −2.4 | −1.0 |
| .551–.599 | 39 | .571 | −2.1 | 0.0 |
| .600 or better | 21 | .633 | −11.0 | −12.6 |
The dots matter as much as the bars, because the means hide violence. The average team, extreme or not, moved 9.7 wins in one direction or the other between consecutive seasons — the bars are small differences between large, noisy swings. Which is exactly what a gravity well looks like in real data: not every object falls, but the field is unmistakable once you average over 210 of them.
The well is asymmetric: winners fall harder than losers climb
Now the part we didn’t expect when we built the pairs. The two tails are mirror images at the start — 21.6 wins above the 81-win pace on one side, 22.0 below it on the other — and not remotely mirror images a year later. The .600+ group fell to an average of .565 (10.6 wins above pace): 51% of their elevation, gone. The sub-.400 group rose to .414 (still 14.0 wins below pace): only 36% of the hole refilled. Sixteen of the 21 elite seasons were followed by a move toward .500, and three of them — the 2021 Giants, the 2022 Mets, the 2018 Red Sox — were followed by drops of 24 or more wins. Only 7 of 21 teams that finished .600 did it again the next year.
The basement is stickier. Nine of the 22 sub-.400 teams were sub-.400 again the following season, and four actually got worse — including the 2023 White Sox, who followed a 61–101 season with the 41–121 catastrophe, and the 2018 Tigers, who fell from 64–98 to 47–114. The escape velocity stories are spectacular when they happen — the 2021 Orioles went 52–110 to 83–79, a 31-win leap; the 2023 Royals went 56–106 to 86–76, a 30-win leap — but they’re four cases out of 22 (the number that cleared .500 at all). We’d offer the obvious mechanism for the asymmetry: a .600 team is usually performing over its true talent and regresses whether it likes it or not, while a .360 team is often bad on purpose, and a rebuild has no obligation to end this particular winter. The W–L columns can’t prove that story, but they’re fully consistent with it — this is regression to the mean operating on one tail and something more deliberate operating on the other.
And the five defiers at the top deserve their footnote: only five .600+ seasons in the decade were followed by a better one, and the list is a roll call of the era’s superstructures — the Astros twice (2017→18 and 2018→19, the latter 103–59 to 107–55), the 2018→19 Yankees, the 2021→22 Dodgers (106–56 to 111–51), and the 2022→23 Braves. Escaping the well’s pull for even one extra year took a roster built like a monument.
One team, end to end
The cleanest single illustration in the file is the 2021 Giants, because the well swallowed them whole. They won 107 games — .660, 26 wins more than an 81-win team — on the strength of a franchise-record season nobody saw coming. The following year they went 81–81. Not 95 wins, not a soft landing in the high 80s: exactly .500, the entire 26-win elevation surrendered in one season, the largest fall by any .600 team in the file (tied, in per-162 terms, by the 2022→23 Mets, 101–61 to 75–87).
The Giants gave back 100% of their distance; the average .600 team gives back about half. If you want the average as a formula, the straight line fit to all 210 pairs is: next win% ≈ 0.207 + 0.586 × this win%, with r = 0.565 — this year explains about 32% of next year. The line passes through .500 at exactly .500 (predicted 81.0 wins — the well’s center is not a metaphor, it’s the fixed point of the regression), and it predicts a .600 team (97.2 wins per 162) comes back at .559 — about 90.5 wins. That slope, 0.586 on nine seasons of pairs, sits comfortably beside the 0.52 the carryover piece fit on its shorter 2021–2024 window — two cuts of the data, same law: keep a bit more than half of what you showed, and donate the rest to the middle of the league.
What it says about 2026’s four outliers
The site’s frozen standings snapshot for that morning (data_layer/mlb_2026_standings_2026-07-26.json, retrieved 2026-07-26, teams averaging 104.7 games played) has exactly four clubs outside the well’s walls: the Dodgers at 67–38 (.638, a 103-win pace), the Brewers at 65–39 (.625), and at the bottom the Rockies at 42–64 (.396) and the Angels at 41–64 (.390). Eighteen of 30 teams sit within fifty points of .500 right now. History’s base rates for the four outliers, if they finish where they stand: the two at the top would each face a one-in-three shot of repeating at .600 or better in 2027 and an average bill of eleven wins; the two at the bottom would be roughly even money to remain awful. One caution before anyone books those odds: this study is about season-to-season pull between final records, and a 105-game record is not a final record — partial-season extremes get partially reeled in before October by ordinary within-season regression, which is a different force than the one measured here. The Dodgers finishing .600+ is likely; what happens to them next year is the bet this article prices.
Limitations, stated plainly
Five honest problems. First, wins and losses are all this file knows — no runs scored or allowed — so we cannot decompose any team’s snap-back into “the luck evaporated” versus “the talent left,” and this site’s own run-differential work shows the run columns carry real extra information about next year. Second, the tails are small: 21 and 22 cases, so single teams tug the means around — drop the 2021 Giants and the elite give-back eases from 11.0 to 10.3 wins; drop the 2021 Orioles’ 31-win leap and the basement rebound falls from 8.0 to 6.9. The direction never budges, and the medians the table carries (−12.6 up top, +8.0 down below) tell the same asymmetric story, but treat the decimals as estimates, not constants. Third, the buckets are arbitrary cutoffs; the regression line is the bucket-free version and tells the same story, so nothing hinges on where we drew the fences. Fourth, the 2019→2021 gap costs us one transition and 30 pairs, and splicing across it would have mixed two-year drift into one-year gravity, so we simply ate the loss. Fifth, this is one decade of one league — a tanking-era decade at that — and the asymmetry in particular (51% vs 36%) may be a property of this competitive regime, not of baseball eternally.
Reproduce it
The decade file ships in the site’s data_layer/ (provenance for every bundled file is logged in data_layer/SOURCE.txt), and the whole finding fits in a dozen lines:
import json, statistics as st
from collections import defaultdict

by = defaultdict(dict)
for t in json.load(open("data_layer/standings_2015_2024.json"))["teams"]:
    by[t["season"]][t["team_id"]] = t

seasons = sorted(by)
pairs = [(by[a][tid], by[b][tid]) for a, b in zip(seasons, seasons[1:])
         if b == a + 1 for tid in by[a]]
print(len(pairs), "back-to-back pairs")

for lab, test in [(">= .600", lambda w: w >= .600), ("<= .400", lambda w: w <= .400)]:
    g = [(t0["winpct"], t1["winpct"]) for t0, t1 in pairs if test(t0["winpct"])]
    m0, m1 = (st.mean(v) for v in zip(*g))
    print(lab, "n=%d" % len(g), round(m0, 3), "->", round(m1, 3),
          "| pulled back %.0f%% of the way to .500" % (100 * (m0 - m1) / (m0 - .5)))

# output:
#   210 back-to-back pairs
#   >= .600 n=21 0.633 -> 0.565 | pulled back 51% of the way to .500
#   <= .400 n=22 0.364 -> 0.414 | pulled back 36% of the way to .500
The chart is charts/chart_gravity_well.py; it reads only the decade JSON and recomputes every bar, dot, and label at run time.
Sources & Further Reading
- Final standings 2015–2024: MLB Stats API regular-season records, bundled as
data_layer/standings_2015_2024.json(retrieved 2026-06-21; 2020’s 60-game season is not in the file). - 2026 standings used for the current-outliers section: MLB Stats API, bundled as
data_layer/mlb_2026_standings_2026-07-26.json— a frozen, dated copy of the live standings file, served alongside it so these figures stay checkable after the next refresh (retrieved 2026-07-26; teams averaged 104.7 games played). - For the same year-over-year question asked with better inputs, this site’s run-differential piece shows why the run columns out-predict the win column.