Here is a piece of sabermetric folklore worth testing: a team’s run differential tells you more about its future than its actual won-lost record does. The claim sounds almost paradoxical — how can a made-up “expected” record beat the real one? — but it falls straight out of the data. Across four recent seasons, a team’s Pythagorean win percentage (built from runs scored and allowed) predicts next year’s record better than its actual win percentage does: r = 0.57 versus 0.54. It’s a small edge, but it’s real and it’s the right direction, and the reason why is the whole point.
The test
For every team I lined up two numbers from one season against its record the following season: its actual winning percentage, and its Pythagorean winning percentage — the record it “should” have had given its runs scored and allowed (RS^1.83 / (RS^1.83 + RA^1.83)). Then I asked which one correlates more strongly with next year’s actual record across all 90 consecutive-season pairs from 2021 through 2024. Whichever wins is the better crystal ball.
The exhibit
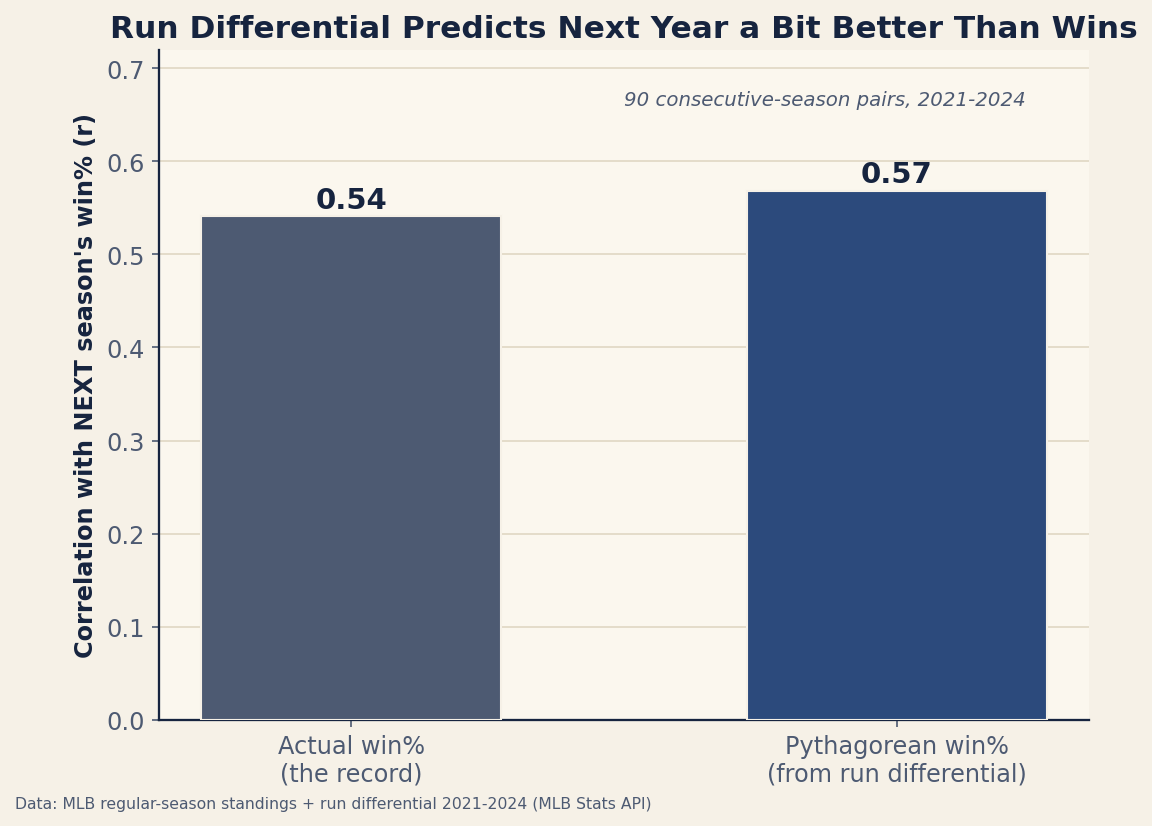
The Pythagorean bar is the taller one. It’s not a blowout — 0.57 versus 0.54 — but the run-differential-based estimate beats the literal record at forecasting the future, every time you’d expect a fluke to favor one or the other. The team’s real won-lost record is the worse predictor of its own future record.
Why the “fake” record wins
The resolution is that a season’s record is part skill and part luck, and the luck doesn’t carry over. The biggest source of that luck is timing — how a team’s runs happened to be distributed across games. Bunch your runs into blowout wins and waste them in close losses and you’ll finish below your run differential; cluster them efficiently and you’ll finish above it. That over- or under-performance is mostly luck, and luck is, by definition, not repeatable.
Run differential strips that timing luck out. By looking at how many runs a team scored and allowed rather than when, the Pythagorean record captures the part of the season that reflects true quality and discards the part that was a coin flip. So when you carry it forward a year, you’re forecasting from the signal instead of the signal-plus-noise. The actual record, by contrast, drags last year’s good or bad timing luck into a prediction where it has no business being — which is exactly why it’s the worse forecaster.
A worked intuition
Picture two 85-win teams. One had a +90 run differential (a true ~91-win team that underperformed by six on bad timing); the other had a +5 differential (a true ~82-win team that overperformed by three on good timing). Their records are identical, so actual win% predicts the same future for both. But they are not the same team: the first is genuinely better and is the better bet to win more next year, while the second is likely to slide back. Pythagorean record sees that difference; the standings don’t. Multiply that across ninety team-seasons and you get the 0.57-versus-0.54 edge — the predictable consequence of forecasting from differential instead of wins. It’s the same logic behind why last year only weakly predicts this year at all: records regress, and run differential regresses less.
Where this read has limits
- The edge is small, and the sample is modest. 0.57 vs 0.54 over 90 pairs from four seasons is a real but narrow gap; a different window would wobble the exact numbers. The direction (Pythagorean > actual) is the robust, repeatable finding documented across far longer histories — not the third decimal.
- Neither number is a great predictor. Both top out near 0.55 because so much changes between seasons — roster turnover, injuries, aging. Run differential is the better baseline, not a strong one; real projection systems beat both by adding player-level forecasts.
- Run differential has its own luck. It removes timing luck but not everything — a team’s RS/RA still carry some sequencing and health noise. It’s a better signal, not a pure one.
- Park and league context. Raw runs aren’t park-adjusted; the Pythagorean estimate inherits whatever distortion the run environment adds, which a fuller model would strip out.
The takeaway
If you want to know how good a team really was — and how good it’s likely to be next year — look at its run differential, not its record. The Pythagorean “expected” win percentage beats the actual one at predicting the future (0.57 to 0.54) for a simple reason: it keeps the signal (how many runs you scored and allowed) and throws away the noise (the lucky timing that turned those runs into a few extra or fewer wins). The standings are what happened; run differential is closer to what was real — and what’s real is what carries over.
Reproduce it
The records and run totals are bundled in data_layer/standings_multiseason.json (2021–2024, MLB Stats API). For each consecutive-season pair, compute year-N actual win% and Pythagorean win% (from RS/RA), then correlate each with year-(N+1) win%. The comparison is regenerated by charts/chart_pythag_predicts_next.py. No network at build time, nothing hand-entered.
Sources & Further Reading
- Free textbook: Chapter 22: Correlation and Simple Linear Regression — the theory behind this, at DataField.dev.
- Standings and run differential 2021–2024: bundled
data_layer/standings_multiseason.json, from the MLB Stats API, charted bycharts/chart_pythag_predicts_next.py. - The Pythagorean win expectation is Bill James's; the “Pythagorean record predicts better than actual record” result is a long-standing finding in the sabermetric literature (Baseball Prospectus, et al.).
- Related: Does last year predict this year? and the luckiest and unluckiest teams — the carryover and the timing luck this piece builds on.