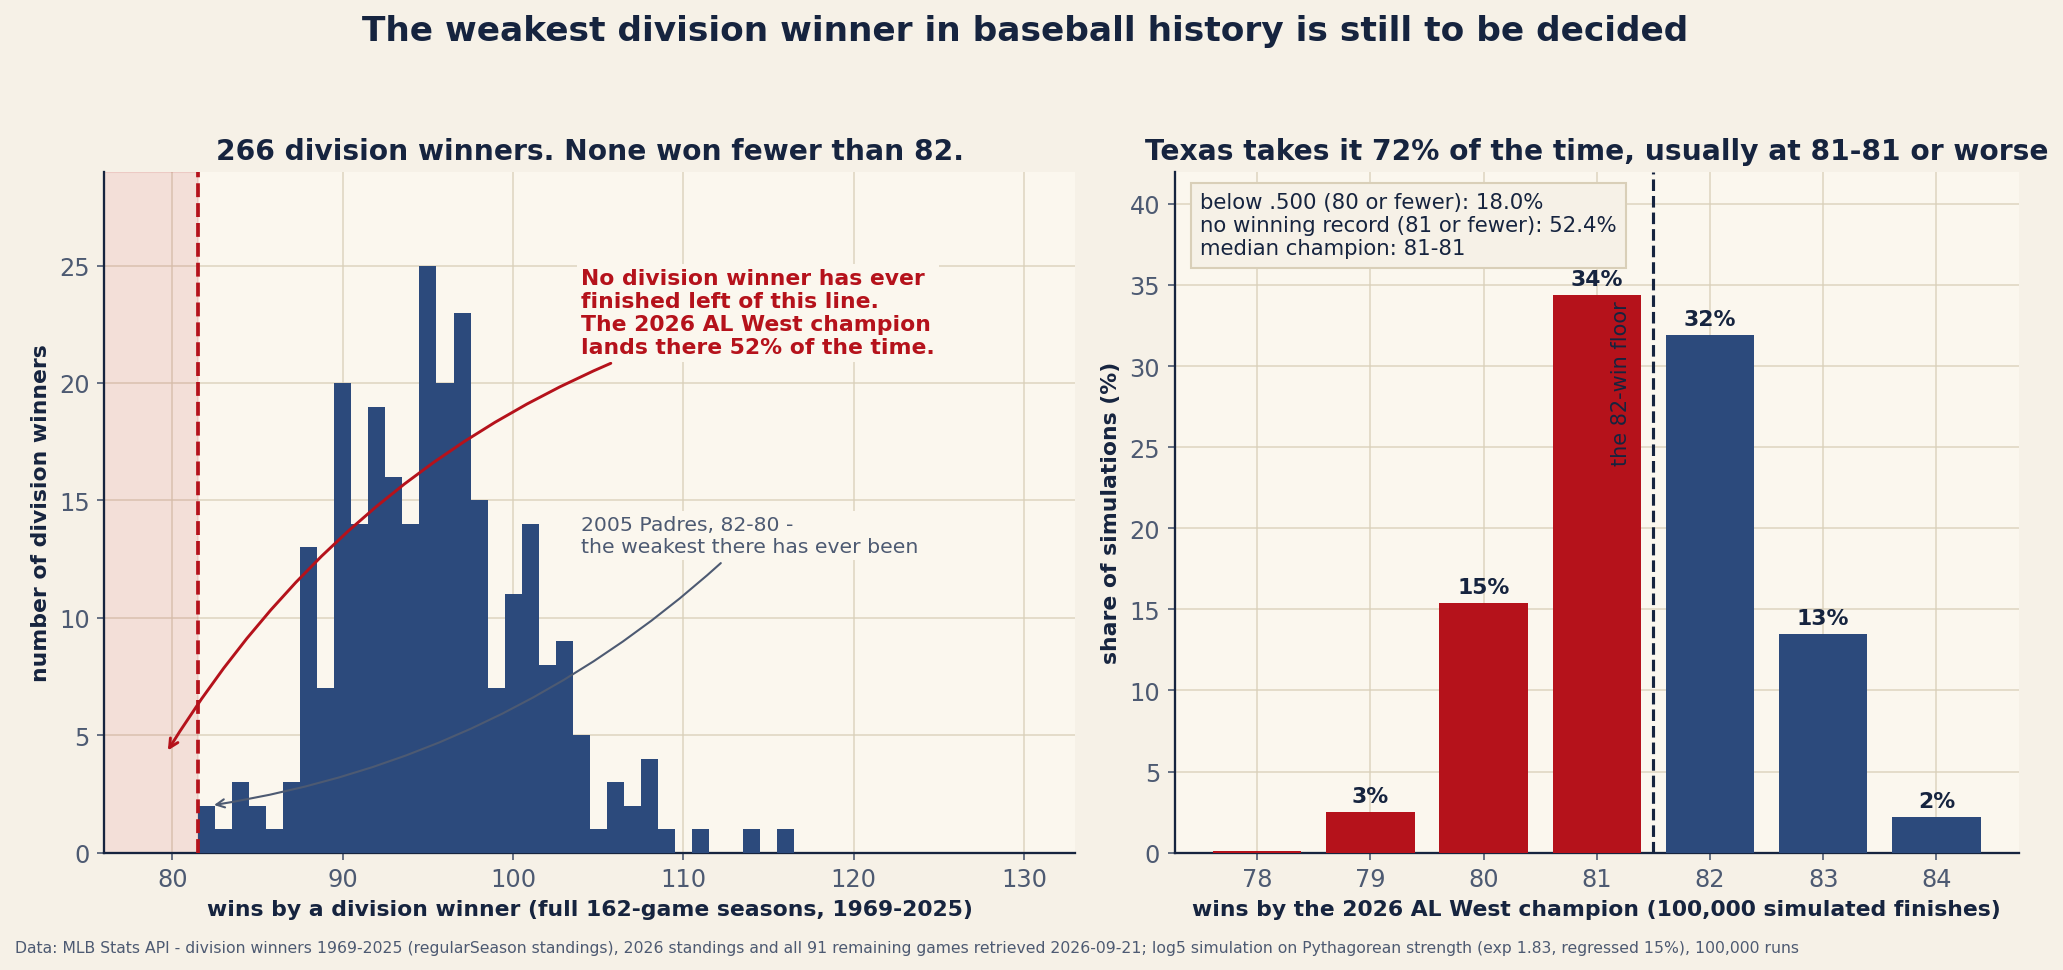
Baseball has had 292 first-place finishes since the leagues split into divisions in 1969, and 266 of them came in a full 162-game season. Not one of those 266 teams finished below .500. The fewest wins any division winner has ever managed is 82, by the 2005 San Diego Padres, who went 82–80 and were outscored by 42 runs on the way. That is the floor. It has held for fifty-seven years.
This morning the American League West is led by a Texas Rangers team that is 78–78 with a run differential of −34, six games left, and nobody behind them playing any better. The floor is in real trouble.
The floor, and the one team that went under it
We pulled the final regular-season standings for every season from 1969 through 2025 from the MLB Stats API, one call per year, and kept every club that finished first in its division. That is the 292. Twenty-six of them come from seasons that were not a full schedule — the 1972 and 1981 strikes, 1994, 1995, and the 60-game 2020 — so they are flagged rather than deleted, and the 82-win floor is computed only on the 266 that played a full year.
Exactly one first-place finish in the entire divisional era came in below .500, and it is a strange one: the 1994 Texas Rangers, 52–62, .456, leading the AL West on August 11 when the strike ended the season. No division titles were awarded that year and no postseason was played, so the Rangers are first-place team without being a champion. It is the only time a club has led a division to the finish line while losing more than it won, and the finish line was moved.
Which makes this year’s situation faintly absurd. The one franchise that has ever been in this position is the franchise that is in it again.
What the division actually looks like
Every club in the AL West has been outscored this season. Not the bottom three — all five.
| Club | W–L | Win% | Run diff. | Home / road left | Closing against |
|---|---|---|---|---|---|
| Rangers | 78–78 | .500 | −34 | 3 / 3 | Mets (3), Twins (3) |
| Astros | 77–79 | .494 | −59 | 0 / 6 | Athletics (4), Mariners (2) |
| Mariners | 73–83 | .468 | −56 | 6 / 0 | Angels (4), Astros (2) |
| Athletics | 61–95 | .391 | −223 | 6 / 0 | Astros (4), Angels (2) |
| Angels | 60–96 | .385 | −87 | 0 / 6 | Mariners (4), Athletics (2) |
Texas cannot finish better than 84–78. A 3–3 week leaves them exactly 81–81, which would be a first-place finish without a winning record — something no full-season division winner has ever produced. To merely match the weakest champion on record they need to go 4–2 against the Mets and the Twins.
Meanwhile, in the same league, the New York Yankees are 89–66 with a run differential of +137 and are six games out of first in the AL East. If the Rangers hold on, the AL West will send a club to October that has been outscored by 34 runs while a club that has outscored its opponents by 137 plays for a wild card. That is not an injustice — it is how divisions work, and it is the price of the format — but it is an unusually blunt illustration of the price.
Pricing the finish
To put a number on it we simulated the remaining schedule 100,000 times. Every one of the 91 undecided games in the majors is in the simulation, not just the West’s, because the West’s opponents have their own reasons to win.
Each club’s strength is its Pythagorean win expectation from actual runs scored and allowed at exponent 1.83, regressed 15 percent toward .500. That matters here: it is the reason Texas is modelled at .480 rather than at the .500 its record shows. A 78–78 club that has been outscored by 34 runs has been beating its run differential, and the honest prior is that it stops. Each game is then a log5 matchup at those strengths, tilted by this season’s own observed home-field edge of .5295 across 2,340 decided games.
| Outcome | Probability |
|---|---|
| Rangers win the division | 71.8% |
| Astros win the division | 28.1% |
| Mariners win the division | 0.1% |
| Champion finishes with 81 wins or fewer | 52.4% |
| Champion finishes below .500 (80 wins or fewer) | 18.0% |
| A tie at the top has to be broken on paper | 19.4% |
The median simulated champion finishes 81–81. Not 82–80, which would tie the record for the weakest ever — one win below it. The single most likely win total for the AL West champion this year, at 34 percent, is a number no division winner has ever posted.
The 18 percent is the one worth sitting with. Roughly one time in five and a half, this ends with a club that lost more games than it won hosting a playoff series.
Run differential has been here before, barely
Being outscored and winning a division is rare but not unprecedented. Six of the 266 full-season winners finished with a negative run differential:
| Season | Club | W–L | Run diff. |
|---|---|---|---|
| 2005 | San Diego Padres | 82–80 | −42 |
| 1987 | Minnesota Twins | 85–77 | −20 |
| 2007 | Arizona Diamondbacks | 90–72 | −20 |
| 1984 | Kansas City Royals | 84–78 | −13 |
| 1997 | San Francisco Giants | 90–72 | −9 |
| 2025 | Cleveland Guardians | 88–74 | −6 |
Six in fifty-seven years, and the Rangers’ current −34 would slot second on that list behind the 2005 Padres. Note what the list does not contain: a single club under 82 wins other than San Diego. The 1987 Twins went on to win the World Series with a negative differential, which remains the loudest argument ever made against reading too much into one.
What this does not settle
The simulation prices schedule, strength and home field. It does not know that a club eliminated in the second week of September may rest its regulars, or that a rotation can be lined up or blown up in a final week. That omission bites harder here than usual because of who is holding the schedule: Houston’s last six are all against the Athletics and the Mariners, and four of them are against a 61–95 club. The two eliminated teams in the division play eight of the twelve games the chasers have left. Texas, meanwhile, faces no division rival at all — three with the Mets, three with the Twins. Whatever a lame-duck September is worth, it is being paid into this race unevenly, and none of it is in the 52.4 percent.
One thing the simulation does price, and it is worth naming because it cuts against Houston: all six of the Astros’ remaining games are on the road, and all six of Seattle’s and Oakland’s are at home. At this season’s .5295 home rate, playing six straight away rather than three and three is worth about a third of a win — small, except that a third of a win is most of what separates first from second here.
Nor is the Pythagorean prior sacred. Texas has beaten its run differential by 3.6 wins this season — 78 actual against 74.4 expected. If that is a real, repeatable property of this particular team rather than sequencing luck, the model is underrating them and every probability above shifts toward 82 and 83 wins. This site has tested that proposition directly and found very little skill in it, which is why the prior is set where it is — but six games is a small enough sample that the distinction barely matters for this particular question.
The bottom line
A record that has stood since 1969 is a coin flip to fall this weekend, and almost nobody is talking about it, because the team about to break it is boring in exactly the way a .500 team is boring. There is no story in 78–78. The story is that 78–78 is leading something.
The AL West will send someone to the playoffs. On the evidence of 2,339 games it will be a club that has been outscored, and better than half the time it will be a club that finished the year having lost at least as many games as it won. If Texas closes 2–4 and holds on at 80–82, they will become the first team in the history of divisional baseball to win one while finishing under .500 — thirty-two years after the same franchise came closest, in a season that was cancelled before anyone had to decide what to call it.
Reproduce it
Three dated files from one morning’s pull. data_layer/division_winners.json is built by data_layer/build_division_winners.py, which calls the MLB Stats API’s regularSeason standings once per season from 1969 through 2025 and records every club finishing first in its division with its wins, losses, runs scored and allowed, division size, and a full_schedule flag plus a note for the five shortened years. data_layer/mlb_2026_standings_2026-09-21.json holds the live standings after 2,339 games, and data_layer/remaining_schedule_2026-09-21.json holds all 91 undecided games partitioned by status, per club, through the last scheduled date of September 27.
The chart-and-verification script charts/chart_sub_500_division.py recomputes every number above from those three files and asserts each against the published value: the 292 and 266 counts, the single sub-.500 finish and its identity, the 82-win floor, the 2005 Padres as weakest and their −42, all six negative-differential winners and their seasons, the median winner’s 95 wins, every AL West record and run differential, the six-games-left and the Rangers’ closing opponents, the .5295 home edge, the reconstruction of all 91 remaining fixtures from the per-club opponent counts, and every probability the simulation reports. It runs the 100,000 seasons from a fixed seed, so the figures above reproduce exactly.
Sources & Further Reading
- MLB Stats API: regular-season standings for every season 1969–2025, the live 2026 standings, and the 2026 schedule feed, all retrieved 2026-09-21. Built by
data_layer/build_division_winners.py,data_layer/build_mlb_2026.pyanddata_layer/build_remaining_schedule.py. - Baseball-Reference: standing reference for the 1994 strike season and the division-era format changes.
- Is Beating Your Run Differential a Skill? Why the Rangers’ four extra wins are priced as luck rather than as a property of the club.
- Why the Best Team Loses in October: what a short series does to the gap between an 81-win club and a 98-win one.
- What an October Seat Actually Costs Now: the win totals the current format has been admitting, and where this would sit.
- Who Wins the Tie? The paper tiebreakers that settle the 19.4 percent of simulations that end level.