Baseball’s current labor contract has an end date written into it. The 2022–2026 Basic Agreement between the clubs and the players’ union says, in Article XXVI: “This Agreement shall terminate on December 1, 2026 at 11:59 P.M. Eastern Time.” Two of the stoppages below, in 1972 and 1990, began after an agreement had run out, so the history is worth having in one place, measured rather than remembered.
We pulled the final standings and the full schedule of every season from 1962 to 2025 from the MLB Stats API and asked a plain question of each stoppage: how many games did it cost, and whom? Four seasons came up short. Counted from the standings, they lost 1,716 games between them. The two lockouts, in 1990 and 2021–22, cost nothing in the standings: both ended with every club playing a full schedule.
Finding the short seasons in the data
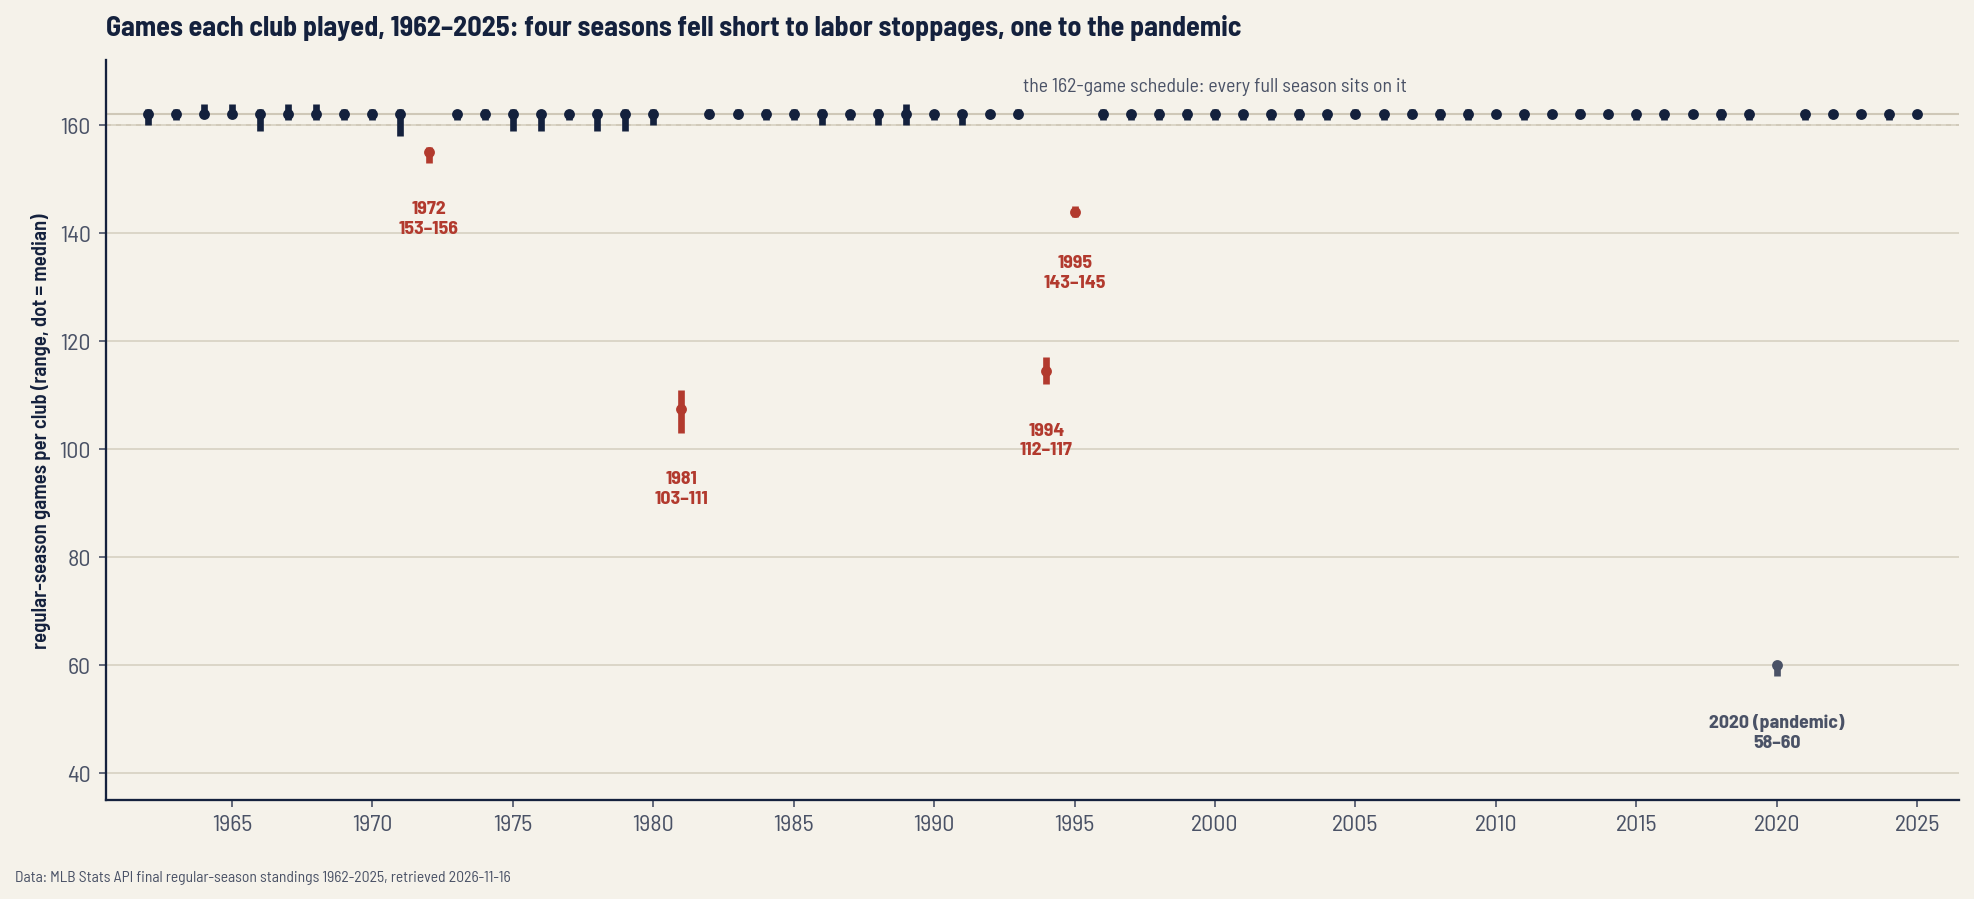
In 1962, the first season in our file, every club in both leagues played about 162 games, and the current agreement still sets that number: “each Club shall be scheduled to play 162 games during each championship season” (Article V). A season where every club gets close to 162 is a full one. Rainouts that are never made up nibble at that number, so we measured the nibbling first. Across the 59 full seasons, the whole league came up 232 team-games short of 162 altogether, about 3.9 a season, and the fewest games any club played was 158 (Baltimore in 1971). No full season had a stretch longer than seven days without a regular-season game.
The rule we used is simple: a season is short when its median club played fewer than 160 games. Five seasons fail it, and none comes close to the cutoff. In 1972 clubs played 153 to 156 games, in 1981 103 to 111, in 1994 112 to 117, in 1995 143 to 145, and in 2020 58 to 60. Four of those are labor stoppages. The fifth, 2020, is not: MLB.com reported a 60-game regular-season schedule after spring training camps were shut down because of the coronavirus pandemic. We keep it in the chart as a yardstick and leave it out of the labor count.
Every stoppage, measured
The table lists each stoppage we could tie to a date in a linked source, plus 2020 for comparison. The middle columns come from our data. “Games not played” is half the sum of every club’s shortfall from 162, so it counts any rainout that was never made up as well; in a full season that adds about two games. The sources do not agree on how many stoppages there have been. The MLBPA’s page on the 1985 strike calls it the fifth since 1972 and its history timeline calls it the sixth, and SABR’s biography of Bud Selig calls the 1990 lockout the seventh in 18 years. The extra ones in those counts are stoppages our sources do not date, so they are not in the table. The data rules out that any of them cost regular-season games: no season from 1962 to 2025 other than the five above lost more than a handful.
| Season | What the source says | Games per club | Games not played | First and last game day | Postseason |
|---|---|---|---|---|---|
| 1972 | Players’ strike at the start of the season (MLBPA: 12 days; SABR: 14 days and 86 games) | 153 to 156 | 85 | April 15 to October 4 | played |
| 1980 | “A brief, eight-day strike” (SABR) | 160 to 163 | none beyond rainouts | April 9 to October 6 | played |
| 1981 | Players’ strike, June 12 to July 31 (SABR: 712 games; MLBPA: 50 days, 713 games) | 103 to 111 | 712 | April 9 to October 5 | split-season format |
| 1985 | A two-day strike in August (MLBPA) | 161 to 163 | none beyond rainouts | April 8 to October 6 | played |
| 1990 | Lockout from February, 32 days; new agreement March 19 (SABR) | 161 to 162 | none beyond rainouts | April 9 to October 3 | played |
| 1994 | Players’ strike from August 12 (SABR) | 112 to 117 | 668 | April 3 to August 11 | none |
| 1995 | The same strike, 232 days in all, ended March 31, 1995; openers April 25 (MLBPA) | 143 to 145 | 251 | April 25 to October 2 | played |
| 2020 | Not a labor stoppage: the pandemic (MLB.com) | 58 to 60 | 1,532 | July 23 to September 27 | played |
| 2022 | A 99-day lockout, new agreement March 10, 2022 (MLBPA) | 162, every club | none | April 7 to October 5 | played |
Our counts land close to the sources’ where both exist. For 1981 we get 712 games, the same as SABR’s figure, one fewer than the MLBPA’s 713. For 1972 we get 85 games, one fewer than SABR’s 86, well within what rainouts alone produce in a full season. The 1994 and 1995 seasons are one stoppage split across two years: 668 games in 1994 and 251 in 1995, when the schedule shrank to 144.
The calendar of each stoppage
The schedule feed shows each stoppage as a hole in the calendar. In the 59 full seasons the median Opening Day was April 4 and none opened later than April 13. The 1972 season opened on April 15, against April 5 in both 1971 and 1973. The 1981 season stopped completely: there was no regular-season game between June 12 and August 9, a gap of 59 days, against at most seven days in any full season. In 1994 the last games were played on August 11, and SABR dates the strike from the next day. The 1995 season opened on April 25, the date the MLBPA gives for the players’ return. The two-day strike of 1985 left a hole of exactly two days, August 6 and 7, with games on both sides, and every club still finished with 161 to 163 games.
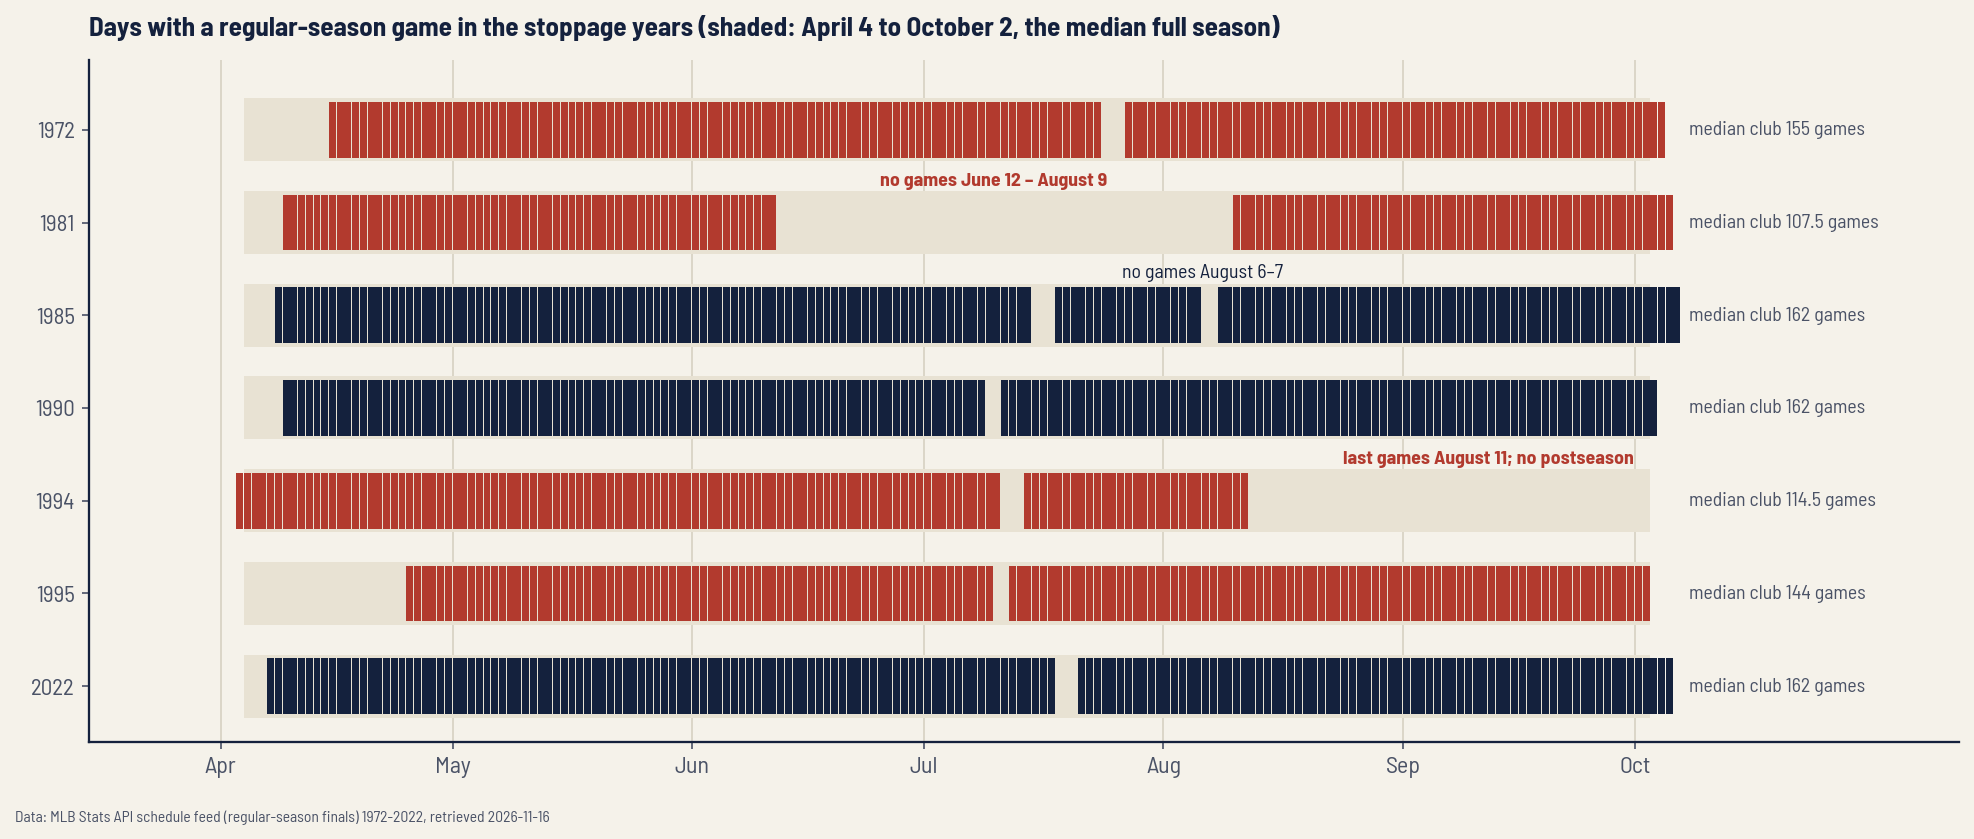
The two lockouts of the last 40 years show up as late starts, not short seasons. SABR’s account of 1990 says the lockout lasted 32 days, wiped out virtually all of spring training, and moved Opening Day back a week to April 9; the data has the first games on April 9 and the last on October 3, against October 1 in 1989 and October 6 in 1991, and every club played 161 or 162. The 2022 season opened on April 7, after the 99-day lockout ended on March 10, against April 1 in 2021, and all 30 clubs played exactly 162. Our sources date the 1980 strike only as eight days, without saying when, and the 1980 data shows a normal season from April 9 with a median club at 162 games.
What the stoppages did to the standings
In 1972, games cancelled at the start of the season were never made up, so clubs finished with different numbers of games. The American League East was decided by half a game: Detroit went 86–70 in 156 games and Boston 85–70 in 155, and Detroit went to the postseason.
The 1981 season was split at the hole in its calendar. Splitting each club’s results at June 11, the eight clubs that led a division before the strike or after it are exactly the eight clubs that played in the 1981 postseason. Two of the four best records in baseball were not among them. Cincinnati, 66–42, had the best record of any club and finished second in both halves, behind the Dodgers (36–21) before the strike and the Astros (33–20) after it. St. Louis, 59–43, had the best record in the National League East and did not qualify. Kansas City did, at 50–53, after going 20–30 before the strike and 30–23 after. One check on our split: the schedule feed has one fewer Reds win and one fewer Phillies loss than the final standings, and we tested both halves for each; no half-season leader changes.
In 1994 the standings simply stopped. Montreal had the best record, 74–40, ahead of the Yankees at 70–43, and Texas led the American League West at 52–62. No postseason game was played, the only season since 1962 without one. Our .500 division winner piece looks at that Texas club in its place among losing first-place teams.
Games lost by each franchise
Here is the cost per franchise, under today’s names, for the four labor-shortened seasons. Each cell is that club’s shortfall from 162 in that season, so a rainout that was never made up counts too. The 24 franchises that existed in 1972 lost 123 to 133 games each, and Baltimore lost the most. Toronto and Seattle, which entered in 1977, missed the 1972 losses. Colorado (63) and Miami (66), which entered in 1993, lost games only in 1994 and 1995. Arizona and Tampa Bay entered in 1998 and lost none.
| Franchise | 1972 | 1981 | 1994 | 1995 | All four |
|---|---|---|---|---|---|
| Baltimore Orioles | 8 | 57 | 50 | 18 | 133 |
| Cleveland Guardians | 6 | 59 | 49 | 18 | 132 |
| Kansas City Royals | 8 | 59 | 47 | 18 | 132 |
| Pittsburgh Pirates | 7 | 59 | 48 | 18 | 132 |
| St. Louis Cardinals | 6 | 59 | 47 | 19 | 131 |
| Texas Rangers | 8 | 57 | 48 | 18 | 131 |
| Chicago White Sox | 8 | 56 | 49 | 17 | 130 |
| New York Mets | 6 | 57 | 49 | 18 | 130 |
| Chicago Cubs | 6 | 56 | 49 | 18 | 129 |
| Atlanta Braves | 7 | 55 | 48 | 18 | 128 |
| New York Yankees | 7 | 55 | 49 | 17 | 128 |
| Cincinnati Reds | 8 | 54 | 47 | 18 | 127 |
| Minnesota Twins | 8 | 52 | 49 | 18 | 127 |
| Athletics | 7 | 53 | 48 | 18 | 126 |
| Boston Red Sox | 7 | 54 | 47 | 18 | 126 |
| Houston Astros | 9 | 52 | 47 | 18 | 126 |
| Philadelphia Phillies | 6 | 55 | 47 | 18 | 126 |
| Washington Nationals | 6 | 54 | 48 | 18 | 126 |
| Los Angeles Dodgers | 7 | 52 | 48 | 18 | 125 |
| Detroit Tigers | 6 | 53 | 47 | 18 | 124 |
| Milwaukee Brewers | 6 | 53 | 47 | 18 | 124 |
| San Diego Padres | 9 | 52 | 45 | 18 | 124 |
| Los Angeles Angels | 7 | 52 | 47 | 17 | 123 |
| San Francisco Giants | 7 | 51 | 47 | 18 | 123 |
| Toronto Blue Jays | – | 56 | 47 | 18 | 121 |
| Seattle Mariners | – | 52 | 50 | 17 | 119 |
| Miami Marlins | – | – | 47 | 19 | 66 |
| Colorado Rockies | – | – | 45 | 18 | 63 |
The 2026 agreement and the salary cap question
The agreement in force today is the one the 2021–22 lockout produced. The MLBPA publishes it on its site, and its term clause is short. Article XXVI, on page 169 of that copy, reads: “This Agreement shall terminate on December 1, 2026 at 11:59 P.M. Eastern Time.” What follows that date is not in any document we can cite, and this page does not guess. If a stoppage starts, its dates go into the table above only once the MLBPA, MLB or another source this site cites publishes them, and the games columns only once a season has been played.
A salary cap has come up in these fights before. The MLBPA’s timeline says that in 1985 “the owners pursue a salary cap, but are quickly rebuffed,” and SABR’s Selig biography says that in 1994 the union “refused to budge on a salary cap.” The 2022 agreement instead raised the thresholds of the Competitive Balance Tax, in the MLBPA’s words. We print no salary or tax figures here, because we have not found two sources that agree on them. For what the money does to the standings, our study of whether MLB is getting more top-heavy measures competitive balance directly.
The history in the data is clear about one pattern. Of the three stoppages that ran through a winter and into spring, only one cost regular-season games: 1990 and 2022 started late but played full schedules, and 1995 lost 18 games a club. The ones that cost the most started in the middle of a season, in 1981 and 1994. If spring training is the part at risk, our piece on whether spring training predicts anything covers what those games tell us in a normal year.
What it adds up to
Counted from the standings, labor stoppages have cost baseball 1,716 regular-season games since 1962, all of them in 1972, 1981, 1994 and 1995, and one postseason. Most franchises old enough to have lived through all four lost 123 to 133 games. The two lockouts, 1990 and 2021–22, cost a late start but no games in the standings. The current agreement ends at 11:59 p.m. Eastern on December 1, 2026. This page is refreshed in place, so the next row, if there is one, will be measured the same way.
Reproduce it
The dataset ships with the site (provenance in data_layer/SOURCE.txt). Our build script makes two calls per season to the MLB Stats API, the final standings and the schedule, and keeps every club’s games and record, each season’s calendar and the 1981 half-season records. Our Stats API guide shows how those endpoints work. This finds the short seasons and the labor count:
import json

path = "data_layer/work_stoppages_1962_2025_2026-11-16.json"
js = json.load(open(path, encoding="utf-8"))
short = [s["season"] for s in js["seasons"] if s["games_per_club"]["median"] < 160]
labor = sum(s["team_games_below_162"] // 2 for s in js["seasons"]
            if s["season"] in (1972, 1981, 1994, 1995))
print(short, labor)   # [1972, 1981, 1994, 1995, 2020] 1716
The charts come from our chart script, which recomputes every number in this article from the file, checks each quoted phrase against saved copies of the source pages, and asserts all of it before it draws.
Sources & Further Reading
- MLB Stats API: final regular-season standings and the season schedule feed (1981 shown; the same call for every season 1962–2025), retrieved 2026-11-16.
- MLBPA: the 2022–2026 Basic Agreement (Article V, Article XXVI, page 169), linked from its Major League CBA page; its history timeline and history pages on 1972, 1981, 1985, 1995 and 2022; read 2026-11-16.
- SABR BioProject: Marvin Miller (1972, 1980, 1981) and Bud Selig (1990, 1994); read 2026-11-16.
- MLB.com: MLB announces 2020 regular season (the 60-game schedule).