The first time someone tells you the league’s own data feed is free and open, you assume there must be a catch — a key to register for, a login, a rate-limit paywall waiting two requests in. There isn’t. Every time a scoreboard on MLB.com flips a score, a phone app refreshes a box score, or a broadcast graphic shows a hitter’s season line, the numbers come from one place: the MLB Stats API, a public JSON feed at statsapi.mlb.com. It is the same plumbing the league uses for its own products, it is wide open, and it never asks you for a key, a login, or a single dollar.
This is a from-scratch tutorial that uses nothing but Python’s requests library — no pybaseball, no scraping, no credentials. By the end you will have hit the live endpoint, walked the JSON it hands back, and charted the 2025 home-run leaders — the exact figure below — in about twenty lines. Then we will point the same technique at standings and the daily schedule, because once you can read one endpoint you can read them all.
One library, no key
The only dependency you truly need is requests, and you almost certainly already have it; if not, pip install requests takes a second. We will add matplotlib for the chart at the end. Here are the imports and the two constants that set everything up:
import requests
import matplotlib.pyplot as plt

BASE = "https://statsapi.mlb.com/api/v1/"
UA = {"User-Agent": "Mozilla/5.0 (mlbanalytic tutorial)"}
Two things are worth a word. The BASE URL ends in /api/v1/ — every endpoint we touch hangs off that root. And UA is a custom User-Agent header. The API is generally happy to serve anonymous requests, but sending a plain, identifiable User-Agent is good manners and sidesteps the occasional default-client block. You pass it along on every call. That is the entire setup; the rest is one request and a little dictionary-walking.
Hit the stats endpoint
The endpoint we want is stats, and the whole art of this API is in the query parameters you attach to it. We ask for season-level hitting stats for 2025, restricted to qualified hitters in the major leagues, and let requests assemble the query string for us via its params argument:
resp = requests.get(
    BASE + "stats",
    params={"stats": "season", "group": "hitting", "season": 2025,
            "sportId": 1, "playerPool": "qualified", "limit": 300},
    headers=UA, timeout=60)
resp.raise_for_status()
data = resp.json()
Read those parameters like a sentence. stats=season asks for full-season totals rather than a game log or career line. group=hitting selects the hitting stat group (swap in pitching or fielding and the same call returns those instead). season=2025 is the year. sportId=1 is the magic number for the major leagues — the same API serves the minors, college, and international ball under other sport IDs, so you must say which one you mean. playerPool=qualified keeps only hitters who cleared the plate-appearance threshold, and limit=300 makes sure the response is large enough to hold them all.
The two lines after the request matter as much as the request itself. raise_for_status() turns any HTTP error — a 404, a 500, a rate-limit — into a clean Python exception instead of letting a broken response slide silently into your code. And resp.json() parses the response body, which arrives as JSON, straight into Python dictionaries and lists. From here on we are just navigating that nested structure.
Walk the JSON
This is the step that intimidates newcomers and shouldn’t. The response is a nested object, but the path to the actual rows is short and always the same shape. The leaderboard lives under ["stats"][0]["splits"] — a list in which each element is one player’s line. Inside each split, the player’s name sits at ["player"]["fullName"] and his counting stats sit under ["stat"], keyed by name. We pull out the three fields we care about into a tidy list of plain dictionaries:
splits = data["stats"][0]["splits"]
recs = [{"player": s["player"]["fullName"],
         "hr": int(s["stat"].get("homeRuns", 0)),
         "ops": float(s["stat"].get("ops", 0) or 0)} for s in splits]
A couple of defensive habits are baked in here. We reach for stats with .get("homeRuns", 0) rather than ["homeRuns"] so that a player missing a field returns zero instead of crashing the loop, and we coerce each value with int(...) or float(...) because the API hands numbers back as strings. The or 0 on the OPS line guards against an empty string sneaking through. The result, recs, is now an ordinary list you can sort, filter, or print however you like — the data has officially escaped the API and become yours.
Sort and find the leaders
Sorting is one line. We order the records by home runs, highest first, and keep the top ten:
recs.sort(key=lambda r: r["hr"], reverse=True)
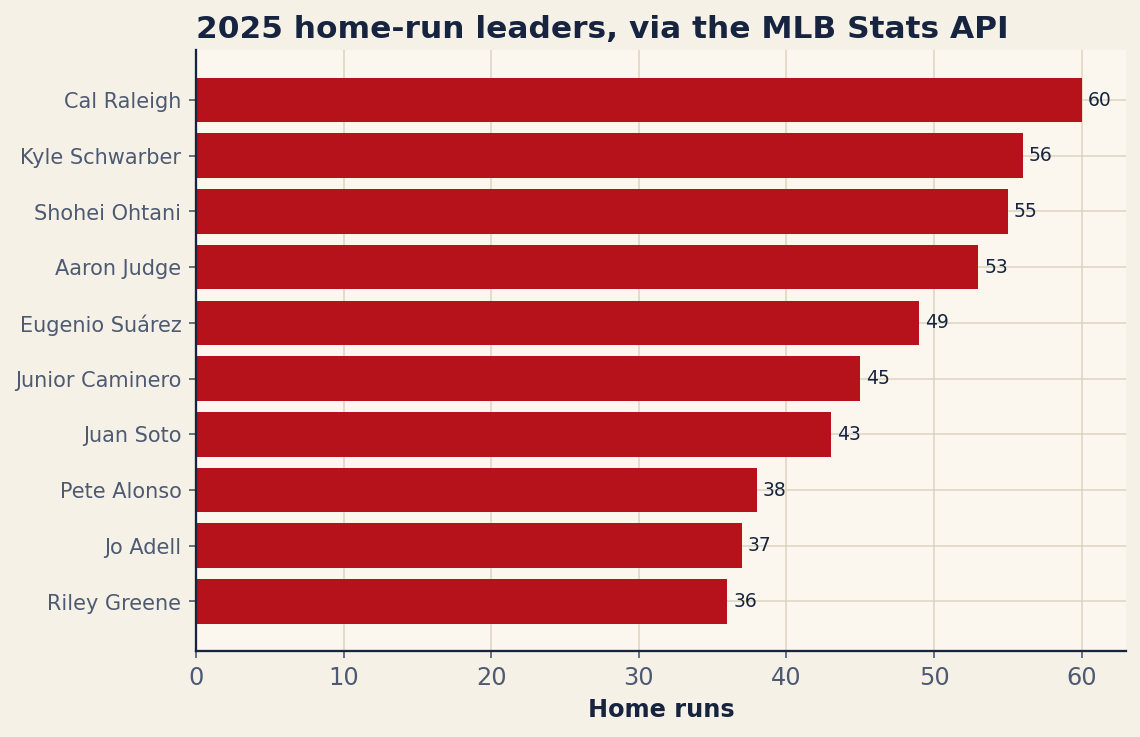
top = recs[:10]The numbers that come back are a good sanity check that the whole pipeline worked. The 2025 home-run crown went to Cal Raleigh with 60 — a catcher leading the majors in homers, which is its own small piece of history — followed by Kyle Schwarber at 56 and Shohei Ohtani at 55. Aaron Judge sat fourth with 53 despite carrying a monstrous 1.145 OPS, far and away the best mark on the board. Here is the full top ten exactly as the script assembled it:
| Player | HR | OPS |
|---|---|---|
| Cal Raleigh | 60 | 0.948 |
| Kyle Schwarber | 56 | 0.928 |
| Shohei Ohtani | 55 | 1.014 |
| Aaron Judge | 53 | 1.145 |
| Eugenio Suárez | 49 | 0.824 |
| Junior Caminero | 45 | 0.846 |
| Juan Soto | 43 | 0.921 |
| Pete Alonso | 38 | 0.871 |
| Jo Adell | 37 | 0.778 |
| Riley Greene | 36 | 0.806 |
That table was not typed by hand; it is the same top list, written straight to the page. Notice how the home-run order and the OPS order disagree — Eugenio Suárez ranks fifth in homers on a relatively modest .824 OPS, while Ohtani’s 1.014 trails only Judge. That tension between raw power and all-around value is exactly the kind of thing you can now explore yourself, because every one of these stats came down in the same response.
Chart the top ten
A list is useful; a picture is persuasive. We draw a horizontal bar chart, which is the natural shape for a ranked list of names. The names and values get reversed with [::-1] because matplotlib draws its first bar at the bottom — reversing puts the leader on top, where a reader expects him:
fig, ax = plt.subplots(figsize=(8.0, 5.2))
names = [r["player"] for r in top][::-1]
vals = [r["hr"] for r in top][::-1]

ax.barh(range(len(names)), vals)
ax.set_yticks(range(len(names)))
ax.set_yticklabels(names, fontsize=10)
ax.set_xlabel("Home runs")
ax.set_title("2025 home-run leaders, via the MLB Stats API", loc="left")

for i, v in enumerate(vals):
    ax.text(v + 0.4, i, str(v), va="center", fontsize=9)

plt.show()
The barh call draws the bars; the two set_yticks / set_yticklabels lines pin each player’s name to his bar. The little for loop is the finishing touch — it writes each home-run total as text just past the end of its bar, so the reader gets both the visual length and the exact number. Swap plt.show() for fig.savefig("hr_leaders.png") if you would rather write the chart to a file. Run it and you get this:
The same trick, two more endpoints
The real reward is that every corner of this API answers to the same pattern: build a URL off BASE, attach parameters, call .json(), walk the result. Two endpoints earn a spot in any toolkit.
The first is standings, which returns the division standings for a given season. You tell it which leagues you want with leagueId — 103 is the American League and 104 is the National League — and which kind of standings with standingsTypes:
resp = requests.get(
    BASE + "standings",
    params={"leagueId": "103,104", "season": 2025,
            "standingsTypes": "regularSeason"},
    headers=UA, timeout=60)
records = resp.json()["records"]   # one entry per division
Each element of records is a division, and inside it teamRecords lists the clubs in order with wins, losses, games back, and run differential. That is a full standings page in two lines of fetching.
The second is schedule, the endpoint behind every “today’s games” scoreboard. Hand it a date and a sportId and it returns that day’s slate — matchups, start times, venues, and, for finished games, the line score:
resp = requests.get(
    BASE + "schedule",
    params={"sportId": 1, "date": "2025-07-04"},
    headers=UA, timeout=60)
games = resp.json()["dates"][0]["games"]   # every game on that date
This is the exact feed that powers public MLB scoreboards. It returns clean JSON, it needs no key, and — the part that delights historians — its coverage reaches back more than a century, into the early 1900s. Point the season or date parameters at a year from the dead-ball era and the API hands you that history in the same format as last night’s box score.
Where this fits, and where to go next
Raw API access is the foundation, not the ceiling. When you want season leaderboards and Statcast pitch-by-pitch wrapped in friendlier function calls, the companion piece on getting started with pybaseball builds on exactly this groundwork — pybaseball is, under the hood, calling endpoints like these for you. And if you want to know how this feed stacks up against Baseball Savant, FanGraphs, and Retrosheet for serious work, our roundup of free public baseball data sources, ranked places it in context.
The bottom line
The distance between “I wonder if I could get that number myself” and a live chart of the home-run leaders is, it turns out, one requests.get, a short walk through a JSON dictionary, and no API key at all. The MLB Stats API is the league’s own data, served plainly and for free, with a century of baseball behind it. Learn the one pattern — URL, params, .json(), walk — and stats, standings, and schedules all open up the same way.
Sources & Further Reading
- Theory: Chapter 7: Introduction to pandas — a free chapter at DataField.dev.
- Leaderboard data: the MLB Stats API (
statsapi.mlb.com, hitting leaders for 2025). Numbers retrieved June 2026; re-runnable viascripts/statsapi_quickstart.py. - Baseball Savant — MLB’s Statcast site, fed by the same league data infrastructure.
- Baseball-Reference — for cross-checking season totals against an independent record.