Every box score records what happened. A line drive that a diving shortstop snared and a line drive that found the gap both leave a trace — one an out, one a double — and the surface stats treat that difference as settled fact. Statcast’s expected stats ask a more interesting question: given how that ball was hit, what usually happens? The gap between the two is where luck, defense, and positioning hide.
The expected family — xBA, xSLG, and xwOBA — reconstructs a hitter’s line from the physics of his contact rather than the fate of his batted balls. Read alongside the real numbers, they tell you whether a hot start is earned, whether a slump is bad luck, and which way a season is likely to bend. They also mislead in specific, predictable ways, and knowing those is half the skill.
How Statcast computes them
The engine is simpler than it sounds. For every batted ball, Statcast records exit velocity and launch angle, then looks up how the entire league has historically fared on balls hit at that speed and angle. A ball smoked at 105 mph and 14 degrees might have become a hit 78% of the time across the database; that ball is credited with an expected batting average of .780 on the play, regardless of whether this particular one was caught. Sum those probabilities over a hitter’s season, divide appropriately, and you have his expected line — what his contact quality, not his luck, says he should have produced.
One important wrinkle: xBA also folds in the batter’s sprint speed, because a fast runner genuinely converts more weakly hit grounders and infield balls into hits than a slow one does. xSLG and xwOBA lean on exit velocity and launch angle alone, since extra-base damage is overwhelmingly about how the ball comes off the bat, not how fast the hitter runs. That single design choice explains a lot of the “misleading” cases later on.
What each number means
xBA is expected batting average: the rate at which a hitter’s batted balls should have become hits, speed included. xSLG is expected slugging, weighting those expected hits by the bases they typically yield — it captures power the way barrel rate does, but expressed on the familiar slugging scale. xwOBA is the most complete of the three: it runs the same expected-outcome logic through the wOBA framework, so walks and hit-by-pitches are included at their real run value alongside expected hits. If you want one expected number that summarizes a hitter’s total offensive contribution, xwOBA is it — the deserved twin of the wOBA on his stat page.
Over- and under-performing your line
The action is in the gap. When a hitter’s actual AVG sits well above his xBA, he is outperforming his contact — getting more out of his batted balls than their quality typically yields. When AVG trails xBA, he is leaving hits on the table. The 2025 leaders in both directions make the spread concrete.
| Player | PA | AVG | xBA | AVG−xBA | SLG | xSLG |
|---|---|---|---|---|---|---|
| Miguel Andujar | 341 | 0.318 | 0.259 | 0.059 | 0.47 | 0.383 |
| Harrison Bader | 501 | 0.277 | 0.22 | 0.057 | 0.449 | 0.374 |
| Jake Mangum | 428 | 0.296 | 0.251 | 0.045 | 0.368 | 0.336 |
| Nick Kurtz | 489 | 0.29 | 0.245 | 0.045 | 0.619 | 0.537 |
| Kyle Isbel | 409 | 0.255 | 0.22 | 0.035 | 0.353 | 0.29 |
| Hunter Goodman | 579 | 0.278 | 0.244 | 0.034 | 0.52 | 0.466 |
| Tommy Edman | 377 | 0.225 | 0.274 | -0.049 | 0.382 | 0.411 |
| Andrés Giménez | 369 | 0.21 | 0.252 | -0.042 | 0.313 | 0.361 |
| Tyrone Taylor | 341 | 0.223 | 0.257 | -0.034 | 0.319 | 0.364 |
| Michael Conforto | 486 | 0.199 | 0.233 | -0.034 | 0.333 | 0.41 |
| Salvador Perez | 641 | 0.236 | 0.269 | -0.033 | 0.446 | 0.534 |
| Jacob Young | 364 | 0.231 | 0.262 | -0.031 | 0.287 | 0.336 |
The biggest overperformer by AVG−xBA in 2025 was Miguel Andujar, who hit .318 against a .259 expected mark — a gap of 59 points. His .470 slugging likewise sat well clear of a .383 xSLG. A 59-point overperformance is enormous; it means Andujar’s surface batting average was flattered by roughly a hit a week beyond what his contact quality supports. At the other pole, Tommy Edman hit just .225 while his xBA said .274 — a 49-point shortfall, a hitter whose results badly lagged the quality of his contact. Salvador Perez (.236 actual, .269 expected) and Michael Conforto (.199 actual, .233 expected) round out the unlucky column, each leaving better than thirty points of average on the field.
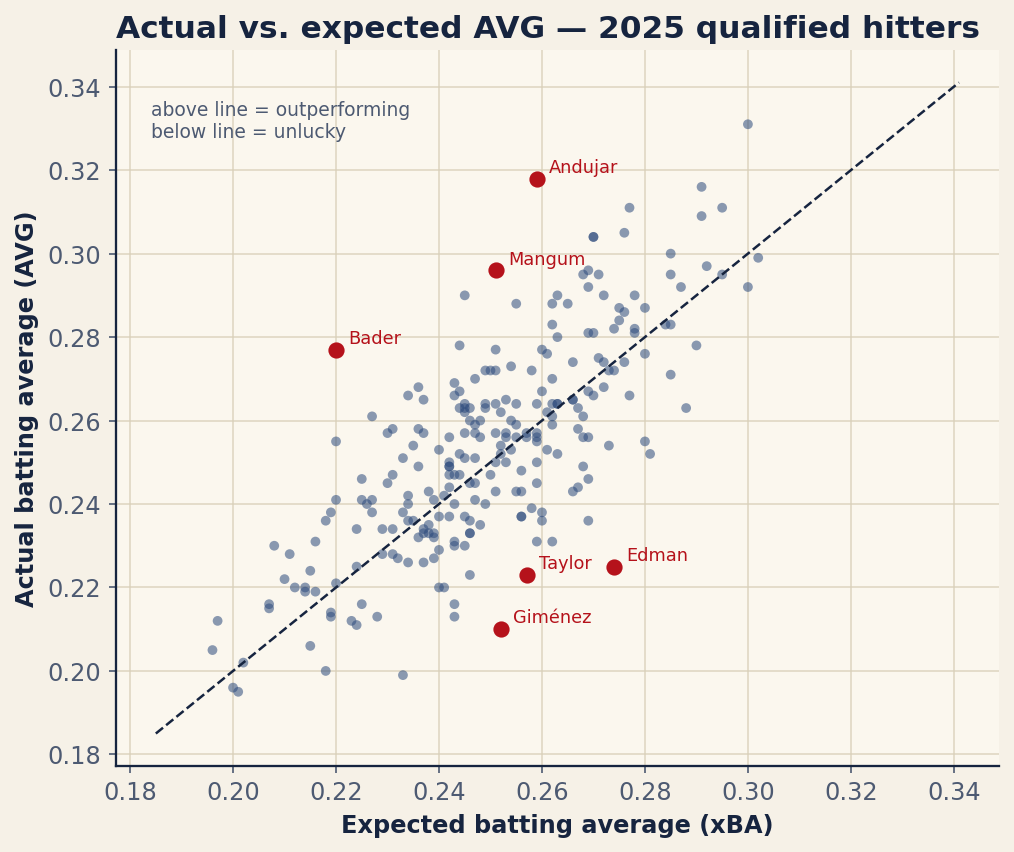
The scatter above plots actual AVG against xBA; the dashed diagonal is the break-even line where a hitter performs exactly to his contact. Andujar sits high above it, Edman well below. Most hitters cluster near the line — for them, results and contact agree, and the expected stats simply confirm the box score.
When expected stats mislead
Here is the part too many people skip: a gap is not automatically luck. Expected stats are blind to several things that are perfectly real, and treating every overperformance as a regression flag will burn you.
Speed beats xBA legitimately. The model includes sprint speed in xBA, but it still tends to under-credit the fastest players, who beat out infield grounders and stretch dribblers into hits at rates the league baseline does not fully capture. A burner who “overperforms” his xBA year after year is not lucky — he is fast, and that is a repeatable skill. Andujar’s case is worth weighing on exactly this axis: some of a persistent gap is noise, but some can be a player legging out hits the model discounts.
Pull hitters versus positioning. Expected stats know how hard and at what angle a ball was hit, but not where the defense was standing. An extreme pull hitter who keeps hammering balls into a stacked infield will underperform his xBA — the contact was excellent, the alignment ate it. That is a defensive-positioning effect, not bad luck, and it can persist as long as defenses keep shading him. The model simply does not see the fielders.
Expected stats know how the ball was hit. They do not know where the defense was standing.
The honest summary: expected stats assume league-average defense and league-average sequencing behind every batted ball. When a specific hitter consistently faces non-average defense — because he is unusually fast, or unusually easy to position against — the gap reflects that reality, not variance.
Using the gap as a regression signal
With those caveats in hand, the gap becomes one of the most useful forward-looking tools available. The working rule: a large AVG−xBA gap with no skill-based explanation tends to shrink. A hitter overperforming on ordinary speed and a normal batted-ball spread is a sell candidate — his average is likely to fall toward his xBA. A hitter underperforming, like Edman or Conforto, is a buy — the hits should start falling. Before you act, ask the screening question: is there a reason for this gap? Elite speed, an extreme pull profile against shifts, a freak BABIP stretch? If yes, discount the regression call. If no, trust it.
And lean hardest on xwOBA when you want the cleanest signal. Because it bundles power and on-base into a single run-value-correct number, the wOBA-minus-xwOBA gap is the most reliable “is this whole season earned?” check in the public toolbox — the same done-versus-deserved logic that makes wOBA the right place to start.
The bottom line
Expected stats do not replace the box score; they audit it. xBA, xSLG, and xwOBA rebuild a hitter’s line from the speed and angle of his contact — speed included, for batting average — and the gap against his real numbers points at luck, defense, or a repeatable skill the model cannot see. A 59-point overperformer like Miguel Andujar and a 49-point underperformer like Tommy Edman are both worth a second look, but only after you ask why the gap is there. Answer that, and you are reading the season ahead of the scoreboard.
Sources & Further Reading
- Theory: Chapter 6: Numerical Summaries: Center, Spread, and Shape — a free chapter at DataField.dev.
- Expected-statistics leaders and batted-ball data: Baseball Savant (Statcast expected-statistics leaderboard, 2025 qualified hitters). Numbers retrieved June 2026; re-runnable via
scripts/expected_stats.py. - MLB.com — the official Statcast glossary entries for xBA, xSLG, and xwOBA, including the sprint-speed component.
- Baseball Savant — per-player expected-stats pages and the underlying launch-speed/angle lookup model.