Here is the thing about batting average that took me an embarrassingly long time to stop ignoring: it thinks a bloop single and a 450-foot home run are the same event. One hit, one tick in the numerator, identical. And a walk? To batting average, a walk simply never happened. Hits over at-bats, one tidy number off the back of a card — a century old and still charming, and still quietly lying to you. Weighted On-Base Average, which everyone just writes as wOBA, is the stat that refuses to pretend those things are equal.
If you make room in your head for exactly one “advanced” hitting number, I’d argue this is the one that earns its keep. The idea behind it is simple and hard to argue with, it sits on a scale you already read fluently, and it ranks hitters more sensibly than the triple-crown stats it quietly retires.
What batting average misses
Two things sink it. First, it throws walks straight in the garbage. A hitter who draws 100 free passes gets nothing for them, even though not making an out is the entire job description. Second, it flattens every hit into one undifferentiated unit. A double is worth meaningfully more than a single, and a homer more still — but batting average grades them all as one point apiece, the way a teacher might if the geometry proof and the multiple-choice question were each worth the same single mark.
So batting average misranks hitters constantly. You don’t have to take my word for it; the 2025 leaderboard a little further down makes the case better than I can.
The wOBA formula
wOBA assigns each way of reaching base a coefficient equal to its real, measured run value, then divides by plate appearances. The weights are recalculated every season from league-wide run expectancy; a representative recent-season version looks like this:
Interactive tool
wOBA Calculator
Weighted On-Base Average from a hitter's events, using a representative recent-season weight set. This interactive calculator needs JavaScript; the formula and explanation above work without it.
Read those coefficients left to right and the whole philosophy is sitting right there. An unintentional walk (0.69) goes for a little less than a single (0.89), which trails a double (1.27), and a home run (2.10) lands at roughly three times the value of that single. None of those are someone’s opinion about what each event “should” be worth — they’re the average number of runs each one has actually produced. And because the weights are anchored to the league’s on-base scale, the payoff is that wOBA reads exactly like on-base percentage: roughly .320 is league-average, .370 is very good, .400 is MVP territory. FanGraphs publishes the precise weights each year, and they drift a few points as the run environment moves.
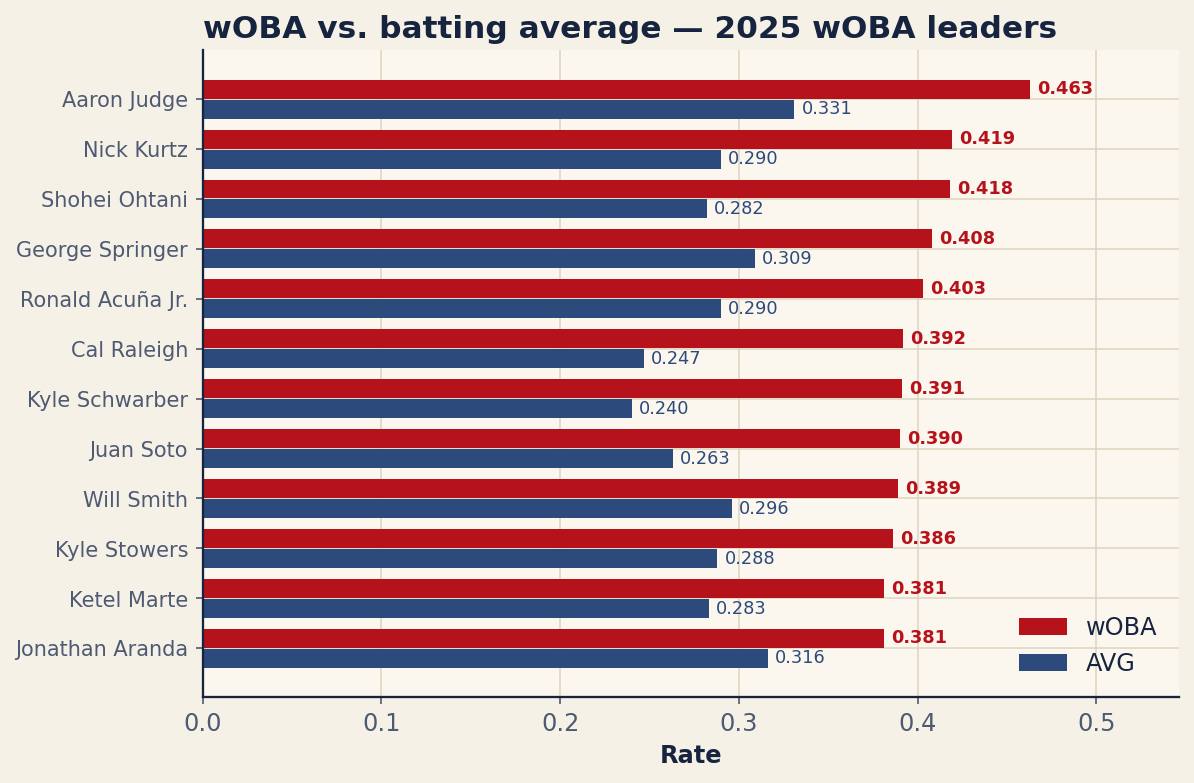
Reading the leaderboard
Here are the 2025 qualified leaders in wOBA, with batting average alongside. Aaron Judge sat on top of both lists at a .463 wOBA and a .331 average — when a hitter is genuinely the best, every stat agrees. The interesting cases are where the two columns disagree.
| Player | PA | AVG | wOBA | xwOBA |
|---|---|---|---|---|
| Aaron Judge | 679 | 0.331 | 0.463 | 0.46 |
| Nick Kurtz | 489 | 0.29 | 0.419 | 0.372 |
| Shohei Ohtani | 727 | 0.282 | 0.418 | 0.425 |
| George Springer | 586 | 0.309 | 0.408 | 0.404 |
| Ronald Acuña Jr. | 412 | 0.29 | 0.403 | 0.397 |
| Cal Raleigh | 705 | 0.247 | 0.392 | 0.371 |
| Kyle Schwarber | 724 | 0.24 | 0.391 | 0.401 |
| Juan Soto | 715 | 0.263 | 0.39 | 0.429 |
| Will Smith | 436 | 0.296 | 0.389 | 0.378 |
| Kyle Stowers | 457 | 0.288 | 0.386 | 0.375 |
| Ketel Marte | 556 | 0.283 | 0.381 | 0.39 |
| Jonathan Aranda | 422 | 0.316 | 0.381 | 0.382 |
My favorite pair here is Kyle Schwarber and Jonathan Aranda. Aranda hit .316 — seventy-six points higher than Schwarber’s .240, which is not a rounding error, that’s a chasm — and yet Schwarber finished with the higher wOBA, .391 to .381. Batting average is screaming that Aranda was the better hitter. wOBA, which actually counts Schwarber’s walks and home runs, shrugs and says no, other way around. Juan Soto is the same trick in miniature: a modest-looking .263 average wrapped around a .390 wOBA, because nearly everything Soto does at the plate — walk, double, homer — is the high-value kind.
wOBA vs. xwOBA
The rightmost column in that table is xwOBA, or expected wOBA. Statcast computes it from the launch speed and angle of each batted ball: given how hard and at what angle a hitter struck the ball, what wOBA would that contact normally produce? It strips out luck, defense, and ballpark.
Usually wOBA and xwOBA sit nearly on top of each other — Judge’s .463 and .460 are basically the same number, which is just a precise way of saying his monster season was entirely earned, no luck propping it up. Soto is the loud exception. His .390 wOBA came with a .429 xwOBA, meaning his contact deserved a great deal more than the scoreboard actually handed him — the kind of gap that tends to close in the hitter’s favor. That distance between what a hitter did and what he deserved is the entire subject of expected stats, and wOBA is the cleanest doorway into it.
When to use wOBA — and when not to
Reach for wOBA whenever you want one clean, roughly park-neutral snapshot of how much a hitter helped his team score. It’s also the engine inside stats you already use: wRC+ is more or less wOBA translated onto a 100-is-average scale and adjusted for park and league.
Two caveats I won’t pretend away. Plain wOBA isn’t park-adjusted, so a hitter calling Coors Field home pockets a small unearned bump — when that matters, go to wRC+. And like any rate stat it needs a real sample to mean anything; fifty plate appearances of wOBA tell you essentially nothing. Give it a few hundred, though, and it becomes about as trustworthy as hitting numbers get.
The bottom line
Batting average answers “how often did this player get a hit?” wOBA answers the question you actually care about: “how much did this player help his team score?” One of those is trivia; the other is the point of hitting. Once you’ve seen a .240 hitter out-produce a .316 hitter, it’s hard to go back.
Sources & Further Reading
- Background reading: Chapter 6: Numerical Summaries: Center, Spread, and Shape, a free textbook chapter at DataField.dev.
- Leaderboard data: Baseball Savant (Statcast expected-statistics leaderboard). Numbers retrieved June 2026; re-runnable via
scripts/woba_leaders.py. - FanGraphs Library — wOBA, including the current-season linear weights.
- Tom Tango, Mitchel Lichtman & Andrew Dolphin, The Book: Playing the Percentages in Baseball — the origin of the run-value weights.