If you spend any time around baseball arguments, two numbers keep showing up to settle the “okay, but is this hitter actually good?” question, and they go about it the same clever way: take a player’s offense, scrub out the ballpark and the league’s run environment, and rescale everything so that 100 is dead average. A 150 is fifty percent better than league. An 80 is twenty percent worse. The two stats are OPS+ and wRC+, and here’s the part nobody leads with: they agree with each other far more than they fight.
They are not, though, the same calculation, and the rare spots where they split tell you something genuine about how we measure hitting. One is built up from on-base and slugging; the other is built down from a single run-value-correct number. Once that clicks, you stop wasting breath on whose 145 is the “real” 145 and start reading each one for what it’s actually good at.
What the two stats share
Start with the common ground, because honestly it’s most of the picture. Both OPS+ and wRC+ are park- and league-adjusted index stats pinned to 100, and that adjustment is the entire reason they were invented. Raw OPS and raw wOBA both hand a hitter free credit for calling Coors Field home and quietly dock one stranded in a pitcher’s park during a low-offense year. The “plus” versions sand that off, so a 130 in Denver and a 130 in San Diego finally mean the same thing — thirty percent above the league’s average bat, once you’ve accounted for where and when the games happened.
That shared scale is why they are usually interchangeable in casual use. If you only remember one rule, remember the anchor: 100 is average, every point above or below is a percentage point of offense, and roughly 150-and-up is a genuine middle-of-the-order season. The disagreement only shows up at the margins — but the margins are where the interesting hitters live.
How OPS+ is built
OPS+ comes from Baseball-Reference, and despite the name it is not simply OPS divided by league OPS. It indexes on-base and slugging separately against the league, then adds them. The league-relative core looks like this:
and that result is then park-adjusted with the batter’s home-ballpark factor. Splitting OBP and SLG apart before adding them is a real upgrade over indexing raw OPS — it keeps a high-OBP, low-SLG hitter from getting averaged into mush — but the structure still smuggles in a bias, and it’s worth naming. Because slugging sits over a denominator of at-bats while on-base spreads across plate appearances, and because the two get summed with equal billing, OPS+ ends up over-crediting slugging relative to the real run value of an extra base. The total-bases hoarder scores a touch higher than his true contribution earns; the walk-heavy grinder scores a touch lower. It’s a small bias. But it’s consistent and it always leans the same direction — which is precisely why the next stat had to exist.
How wRC+ is built
wRC+ comes from FanGraphs and takes the opposite road. It starts from wOBA, which already weights every walk, single, double, triple, and home run by its measured run value — a home run is worth its run value, not just its four total bases. wRC+ converts that wOBA into runs above average, layers in the park factor and the league’s run-per-PA baseline, and rescales to 100. Because the foundation is run-value-correct from the first step, wRC+ does not have OPS+’s slugging tilt. An extra double and an extra walk are each credited at precisely what they have historically been worth on the scoreboard, no more.
That, right there, is the whole philosophical split. OPS+ bolts together two familiar rate stats and swallows a known, modest distortion as the cost of using ingredients sitting on every stat page. wRC+ pays in the same currency — runs — at every single step, so it never has to circle back and apologize for itself.
The 2025 leaders
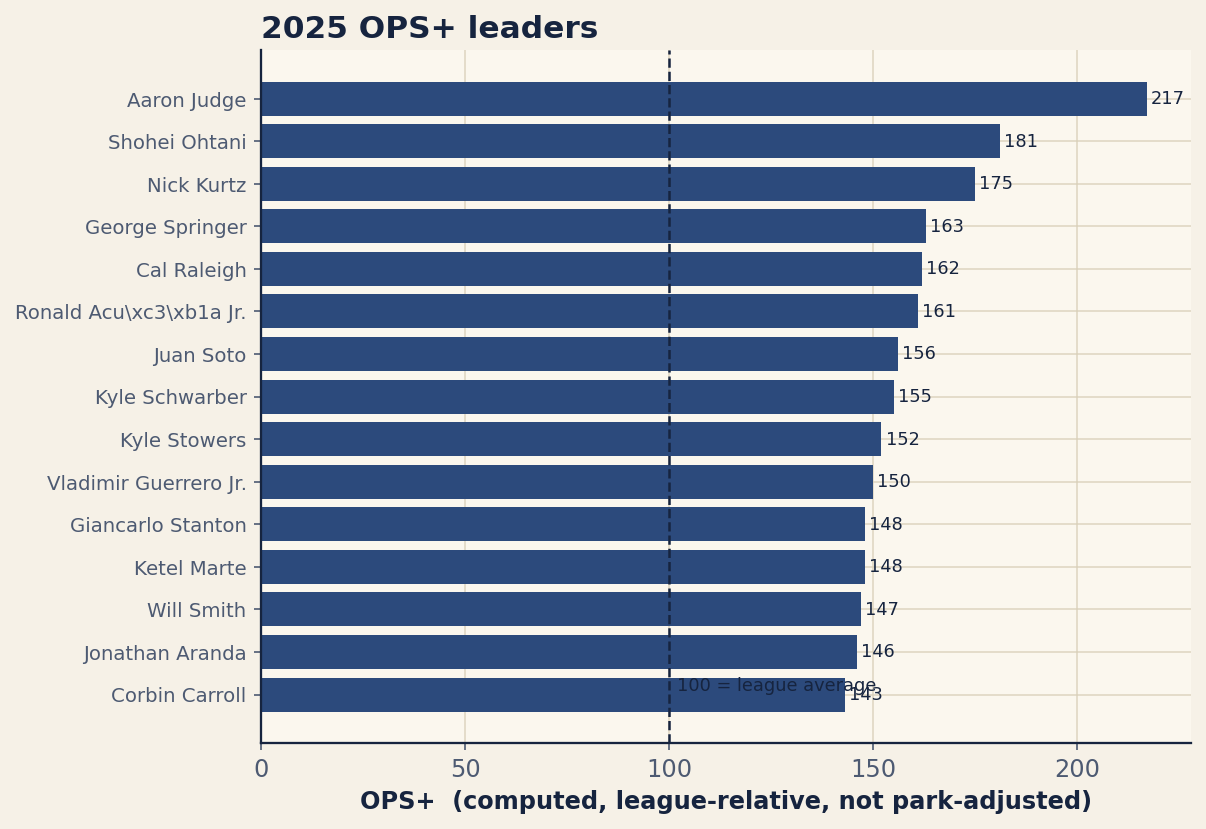
Here is where honesty matters more than completeness. FanGraphs blocks automated data pulls — a scripted request comes back HTTP 403 — so the table below shows real, computed OPS+ for the 2025 qualified leaders, and we discuss wRC+ conceptually rather than auto-pulling a column we could not verify. The OPS+ figures here are computed from Baseball-Reference’s on-base and slugging components against a league OBP of .315 and SLG of .403. Note the caption’s caveat: these are the un-park-adjusted, league-relative form of the formula above, so a hitter’s true park-adjusted OPS+ would nudge a few points in either direction.
| Player | PA | OBP | SLG | OPS+ |
|---|---|---|---|---|
| Aaron Judge | 710 | 0.462 | 0.688 | 217 |
| Shohei Ohtani | 811 | 0.393 | 0.629 | 181 |
| Nick Kurtz | 489 | 0.383 | 0.619 | 175 |
| George Springer | 661 | 0.393 | 0.559 | 163 |
| Cal Raleigh | 759 | 0.362 | 0.595 | 162 |
| Ronald Acu\xc3\xb1a Jr. | 412 | 0.417 | 0.518 | 161 |
| Juan Soto | 715 | 0.396 | 0.525 | 156 |
| Kyle Schwarber | 742 | 0.363 | 0.565 | 155 |
| Kyle Stowers | 457 | 0.368 | 0.544 | 152 |
| Vladimir Guerrero Jr. | 769 | 0.394 | 0.503 | 150 |
| Giancarlo Stanton | 311 | 0.342 | 0.564 | 148 |
| Ketel Marte | 556 | 0.376 | 0.517 | 148 |
| Will Smith | 502 | 0.398 | 0.486 | 147 |
| Jonathan Aranda | 422 | 0.393 | 0.489 | 146 |
| Corbin Carroll | 642 | 0.343 | 0.541 | 143 |
Aaron Judge sits on top at 217, which is the kind of number that doesn’t start arguments so much as end them — a .462 OBP wrapped around a .688 slugging leaves no daylight for any methodology to quibble over. Shohei Ohtani (181) and Nick Kurtz (175) trail him. But the cases that actually teach you something are further down the list. Compare Cal Raleigh and Ronald Acuña Jr., separated by a single point at 162 and 161. Raleigh got there on a .595 slugging with a more ordinary .362 OBP; Acuña got there on a sky-high .417 OBP and a relatively modest .518 slugging. This is precisely the seam where OPS+ and wRC+ would diverge: OPS+’s slugging tilt flatters Raleigh’s profile slightly and shortchanges Acuña’s on-base, so a wRC+ leaderboard would very plausibly flip those two and rank the higher-OBP hitter ahead. Juan Soto’s 156, built on a .396 OBP and a comparatively tame .525 slugging, is the same story — a walk-and-on-base profile that wRC+ tends to reward a hair more than OPS+ does.
Why they diverge — and which to trust
The pattern is predictable once you know the mechanism. Two hitters with the same OPS+ but different shapes — one slugging-heavy, one on-base-heavy — will show up with different wRC+. The slugger’s wRC+ usually dips a point or three below his OPS+; the on-base hitter’s usually climbs. For most players the gap is inside the noise, single digits at most, and either stat ranks the league sensibly. It is only the extreme profiles — the pure masher, the pure walk machine — where the choice of stat changes the verdict.
OPS+ adds two rate stats and tolerates a small, known bias. wRC+ pays in runs at every step and never has to apologize.
So which one do you reach for? When wRC+ is in front of you, take it — it’s run-value-correct by construction, it’s the cleaner number, and it’s what analysts default to for good reason. But I’d push back hard on treating OPS+ as a consolation prize. It’s park- and league-adjusted, it’s on the same 100-is-average scale, you can compute it transparently from numbers on any player page, and it lands within a few points of wRC+ for nearly everyone alive. As a stand-in you can find anywhere — on a site that doesn’t carry FanGraphs’ stat, or in a quick back-of-the-envelope check — OPS+ does the job and rarely lies by much. I use it without guilt.
The bottom line
OPS+ and wRC+ are answering the identical question — how much better than average is this bat, after the park and the era are accounted for — and they reach nearly the same answer almost every time. The difference is in the build: OPS+ stacks OBP and SLG and accepts a gentle slugging tilt; wRC+ starts from wOBA and stays run-value-correct throughout. Reach for wRC+ when you can get it. Reach for OPS+ when you cannot, and trust it — just know which way it leans.
Sources & Further Reading
- For the fundamentals, see Chapter 6: Numerical Summaries: Center, Spread, and Shape in DataField.dev’s free textbook library.
- OPS+ leaders computed from Baseball-Reference on-base and slugging components (2025 qualified batters, league OBP .315 / SLG .403). Numbers retrieved June 2026; re-runnable via
scripts/opsplus_vs_wrcplus.py. - FanGraphs — home of wRC+ and the wOBA it is built on. (Automated pulls are blocked, HTTP 403; wRC+ values must be read manually from the site.)
- Baseball-Reference glossary — the OPS+ definition and park-factor methodology.