Every September, contenders get handed an assumption. A club fifteen games out has stopped caring, its lineup is full of call-ups auditioning for next spring, and three games against it are closer to a gift than a series. This site’s own remaining-schedule piece carries a mild version of that caveat, about rosters remade by clubs playing out the string. The idea is rarely tested properly, so this piece tests it: every game from June to season’s end across fifteen regular seasons, 2010 through 2025, with each club’s status fixed on the first of the month and each game priced from both teams’ records on that date.
The short version: clubs that were 10 or more games out of a playoff spot on September 1 won 37.8 fewer games than the model expected across 161 team-Septembers. That is 0.23 wins per club per September, about one win in every 120 games, and 1.14 standard errors from zero. The drop that does look real comes a month earlier. In August, clubs 5.5 to 9.5 games out fell 70.8 wins short across 76 team-Augusts, 3.10 standard errors below expectation, and those are the clubs that had just sold at the trade deadline. Out-of-it teams don’t quit in September. Most of the damage was done in July, in the front office.
How the test works
Three pieces. Status: on the first of June, July, August and September, every club either holds a playoff position (a division lead, or a wild card under that year’s format: one per league through 2011, two through 2021, three since) or sits some number of games out, measured to whichever is nearer, its division leader or the last wild-card holder. The out-of-position clubs go into three buckets: 5 games or fewer, 5.5 to 9.5, and 10 or more. Talent: each club’s record on that date, regressed toward .500. Across the 450 full seasons in the sample, winning percentage has a standard deviation of .0759. A 162-game record carries coin-flip noise of √(.25/162) on top of real talent, which leaves a talent spread of about .0650. The hot-September piece derived the same figure from the same seasons, and the regression explainer covers why the pull exists at all. Expectation: each game is priced with Bill James’ log5 in odds form, plus a home edge set to the pooled home winning rate of every game measured: 13,050 of 24,338, or .5362.
The residual is actual wins minus expected wins, summed by bucket. The part of the design that matters is the placebo. If the model has a blind spot for bad teams, and records systematically overrate or underrate them, it will show up in June and July. Those months come before the deadline and long before anyone is playing out a string. A September number only means something next to them.
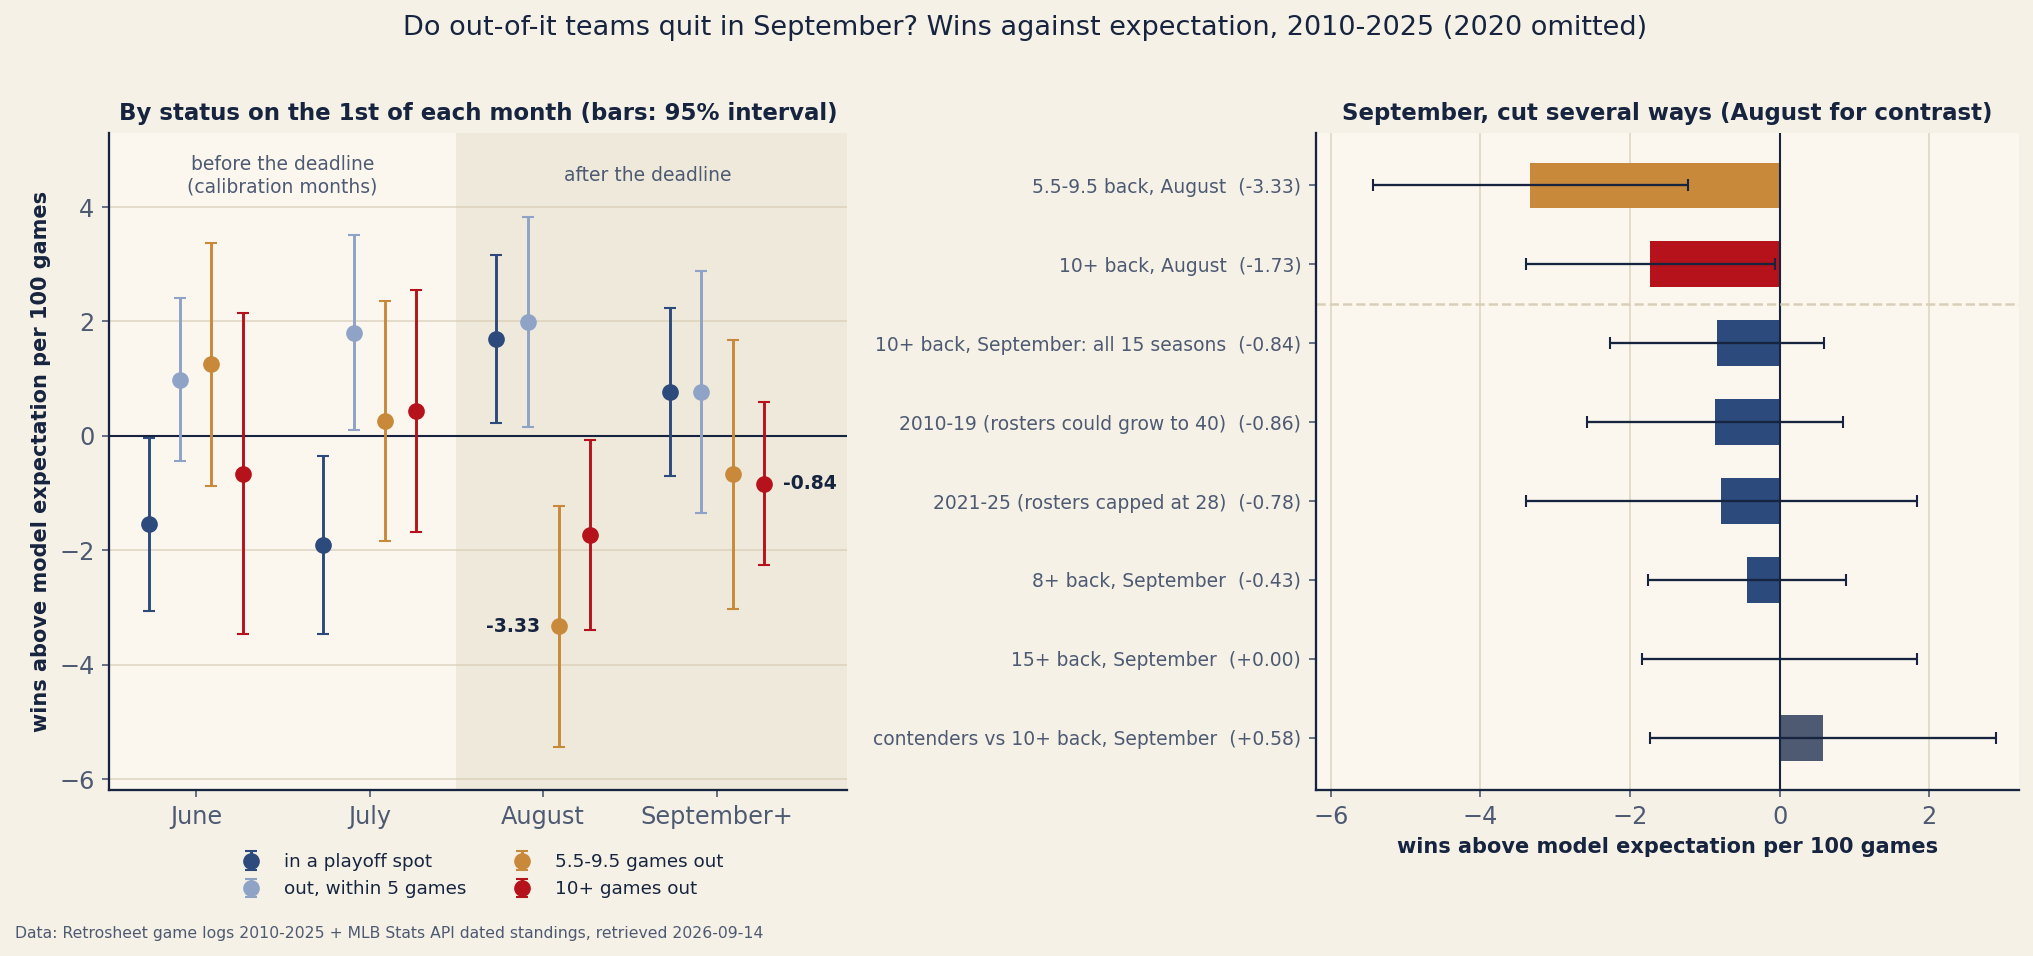
September: a quarter of a win
Start with the raw numbers, because they flatter the dead teams. Clubs 10 or more back on September 1 were a combined 9,039–12,512 at that point, a .419 clip, and played .431 ball the rest of the way. That looks like improvement. It is regression: pulled toward .500 and priced against the opponents they actually faced, those same clubs should have played .439. They went 1,949–2,575 against an expectation of 1,986.8 wins.
A 37.8-win shortfall over 4,524 games comes to 0.84 wins per 100. One standard error of the model’s own noise over that many games is 33.0 wins, so the shortfall barely clears one of them. The cutoff moves the number around without making it bigger. Clubs 8 or more games out fell 0.43 per 100 short. The 97 team-Septembers that began 15 or more games out won 1,152 games against an expected 1,152.0, so the deadest teams in the sample show no shortfall at all.
Their opponents didn’t notice anything either. Clubs holding a playoff spot on September 1 played 1,690 games against 10+-back clubs and won 1,042, against 1,032.2 expected. That is 9.8 extra wins across fifteen Septembers, 0.58 per 100 games, and 0.49 standard errors from nothing.
August is where it happens
Read the left panel in order. June and July are the calibration months, and for bad teams the model is close: clubs 5.5 or more games out ran 0.56 and 0.34 wins per 100 games above expectation. Then comes the deadline, and August breaks both ways. Clubs 5.5–9.5 back on August 1 fell 3.33 wins per 100 short (z = −3.10) and clubs 10+ back fell 1.73 short (z = −2.04). On the other side, clubs holding a playoff spot beat expectation by 1.69 per 100 and clubs within five games by 1.99. Talent moved from sellers to buyers, and the standings recorded it in the first month the new rosters played together.
The group hit hardest is the telling one. It isn’t the hopeless clubs. It’s the ones five to nine games out, close enough to have been in the race in June and far enough behind by late July to sell. They lost 70.8 wins against the model across 76 team-Augusts, 0.93 wins apiece, about four times September’s quarter-win per club.
September is not perfectly clean, and we don’t want to oversell the null. Put the 5.5-and-out clubs together and measure each month against their own pre-deadline months instead of against zero. September then sits 1.1 to 1.4 wins per 100 below that baseline, and August sits 2.7 to 2.9 below it. So the September residue is real enough to mention and about half the size of August’s. That is what you would expect from rosters that got worse at the deadline and stayed that way. September’s talent estimate absorbs only one month of post-deadline play, so some of the loss carries forward. Records alone can’t prove that decomposition. They can say that nothing new, and nothing large, starts on September 1.
The call-up test
The classic mechanism for September surrender was the call-up. Before 2020 a club could activate as much of its 40-man roster as it liked from September 1; since then the limit has been 28, two more than the season-long 26. MLB.com’s roster-expansion explainer and a Phillies Nation report on this month’s expansion both say so. If flooding lineups with auditions cost dead teams games, the 40-man era should show it. It doesn’t. Clubs 10+ back fell 0.86 wins per 100 short in 2010–2019, over 3,180 games, and 0.78 in 2021–2025, over 1,344. Both numbers sit inside one standard error of zero and within a tenth of a win of each other. The roster cap didn’t change September, because there was no September effect for it to change.
A worked example: three games in the Bronx
On the morning of September 1, 2026, the Rockies were 52–86, 21.0 games out of the National League’s last seat, and the Yankees were 78–60. The Rockies’ .3768 over 138 games is shrunk by the factor v / (v + .25/138) = .00422 / (.00422 + .00181) = 0.700, so their talent estimate is .5 + 0.700 × (.3768 − .5) = .4138. The Yankees’ .5652 becomes .5456 the same way. For a game at Yankee Stadium:
The two teams met September 8–10, and the Yankees won all three, 1.01 wins above the 1.99 the model expected. One series at a time, a dead team’s September looks like that: a sweep that feels like surrender. The Rockies are 3–8 in September through the 13th, 1.49 wins below their 4.49 expected. Run that same arithmetic over all 161 team-Septembers in the sample and the misses on both sides nearly cancel. The total is −37.8 wins, and divided by 161 it is the quarter-win in the headline.
2026: the five clubs that were done on September 1
This data was pulled on the morning of September 14, before any of that day’s games, and runs through the games of September 13: 2,245 decided games in all. Five clubs began the month 10 or more games out of a playoff spot: the Mets (11.0 back), the Giants (16.0), the Athletics and Angels (16.5 each) and the Rockies (21.0). Together they are 26–31 in September against 24.21 expected wins, 1.79 ahead of the model. The Athletics are 8–4 (5.23 expected) and the Mets 7–4 (4.85). The Angels and Rockies are 3–8 apiece (4.28 and 4.49 expected), and the Giants 5–7 (5.36). Fifty-seven games is noise in any direction, and we would print the same paragraph if the total were 22–35. August pointed the other way at a similar scale. The six clubs 10+ back on August 1 went 69–97 against 72.77 expected, while the twelve clubs holding playoff spots ran 9.47 wins ahead.
The practical use is in the races. As of September 13, eight clubs are 10 or more games out of a spot, and 48 of the season’s remaining 185 games pit one of them against a club holding a playoff position. That is 48 of the 149 games those contenders have left. At the historical September rate of 0.58 extra wins per 100, the quitting discount on all 48 games put together is 0.28 wins. Price the soft spots by record, the way the remaining-schedule piece does, leave the motivation adjustment out, and use the variance yardstick for what the last two weeks can actually move.
Limitations, stated plainly
The model is not perfectly calibrated at the top. Clubs holding a playoff spot on June 1 and July 1 fell 1.55 and 1.90 wins per 100 short, which says early-summer records overrate the leaders slightly more than a single league-wide regression allows. It is the same pull the .500 gravity well finds between seasons. That is why the September verdict above is measured against each group’s own June and July, not only against zero. The standard errors treat each game’s expectation as known and ignore the error in the talent estimates, so they overstate precision a little. The August result (z = −3.10) survives that. The September results don’t need it.
The buckets are bright lines we chose; the 8- and 15-game cuts are shown above. So is the talent spread. At .055 the September 10+ shortfall grows to 1.48 wins per 100, and at .075 it shrinks to 0.35, while August’s 5.5–9.5 shortfall stays between 3.19 and 3.51 either way. Status is frozen on the first of the month, so a club that falls out on September 10 stays in its September 1 bucket. On 9 of the 120 league cut-dates the last wild-card holder and the first club out had identical records, and the sort broke those ties by team id. 2020 is excluded, because a 60-game season has no June or July. Finally, wins are not effort. This test can’t see rested regulars, shut-down young pitchers or the lineup card. It measures only what reaches the standings, which is the one thing a race cares about.
Reproduce it
Two frozen files from one pull. data_layer/out_of_it_2010_2026_2026-09-14.json holds, for June, July, August and September of every season 2010–2025 plus 2026, the standings at each cut and every decided game in the window. It is built by data_layer/build_out_of_it_2010_2026.py from Retrosheet game logs and the MLB Stats API’s schedule feed, and every club’s record at every cut is reconciled exactly against the API’s dated standings or the build aborts. The second file is data_layer/mlb_2026_standings_2026-09-14.json. The chart-and-verification script charts/chart_out_of_it.py recomputes every figure in this piece from those files and asserts each one against the published value: the status buckets, the regression and home edge, all sixteen month-by-status residuals, the era split, both robustness sweeps, the contender pairs, the 2026 clubs and the worked example, 133 checks in all.
Sources & Further Reading
- Retrosheet game logs, regular seasons 2010–2025. The information used here was obtained free of charge from and is copyrighted by Retrosheet. Interested parties may contact Retrosheet at www.retrosheet.org.
- MLB Stats API: dated standings (every cut, 2010–2026) and the 2026 schedule feed, retrieved 2026-09-14.
- MLB.com, “What to know about Sept. roster expansion” (August 31, 2021): 28-man September rosters, and expansion up to the full 40-man roster before 2020.
- Phillies Nation, September 1, 2026: rosters expanding from 26 to 28 for September.
- Does a Hot September Carry Into October? The other end of the stretch run: whether form among playoff teams means anything in October.
- The Schedule They Have Left: remaining strength of schedule, priced by record, which this piece says is the right way to price it.
- Regression to the Mean, Explained: the pull the talent estimates rely on.
- The 2026 Playoff Races, Priced: how far luck alone can move a race.